GBP/USD 5-Minute Analysis
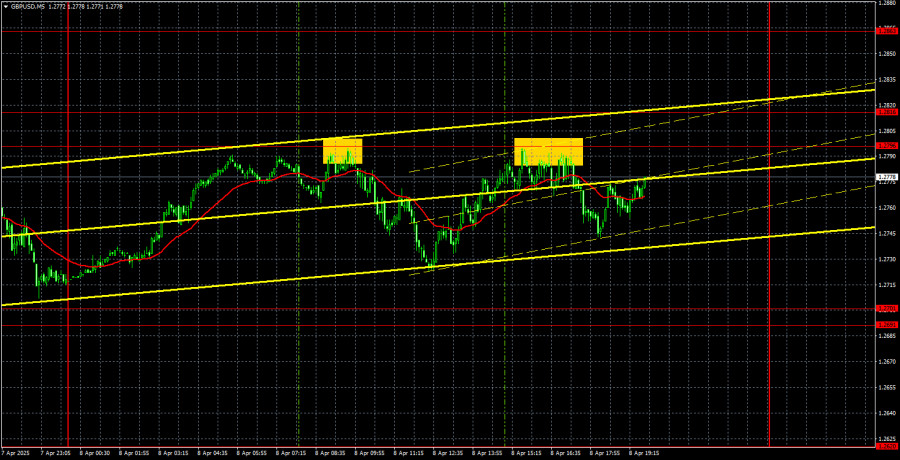
The GBP/USD currency pair made a slight upward correction on Tuesday but failed to break through the nearest resistance level. Thus, after a 500-pip decline, we have seen virtually no correction—at least for now. However, traders should not get complacent. The tariff war is far from over and hasn't even entered a phase of calm implementation. Trump continues to issue new statements daily about tariffs against everyone who dares to challenge him. He also insists that many countries want to sign trade deals with the U.S. and are "already on their way to the White House." We believe few are interested in deals with Zimbabwe, while China, the European Union, Canada, Japan, and South Korea are of far greater importance. The problem is that the probability of striking a deal with these key players is close to zero. That said, Trump will no doubt eventually present a list of 50 countries with which he claims to have made deals and portray it as a victory—regardless of whether the trade volume with each is minimal.
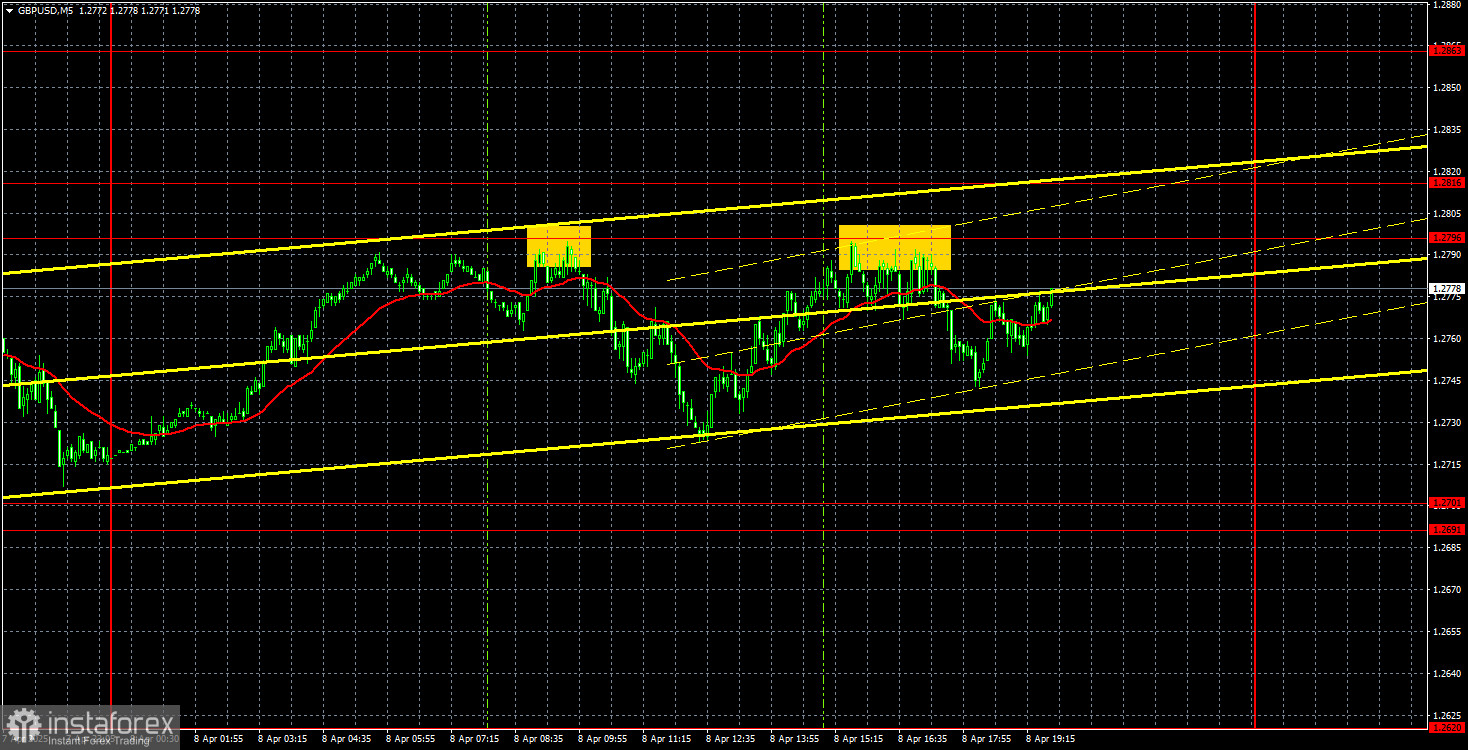
From a technical perspective, there is little to be said right now. The pair was in a flat range for a month, then surged sharply, only to crash back down like a stone. Currently, there is no clear trend or trendline to follow. The market continues to trade on emotion, and one can't blame it. Investors and traders are simply trying to protect their assets' value.
Two sell signals were generated on Tuesday in the 5-minute timeframe. The price bounced twice from the 1.2796 level. However, the target level of 1.2701 was never reached. As a result, any profits could have only been secured through manual trade closure.
COT Report
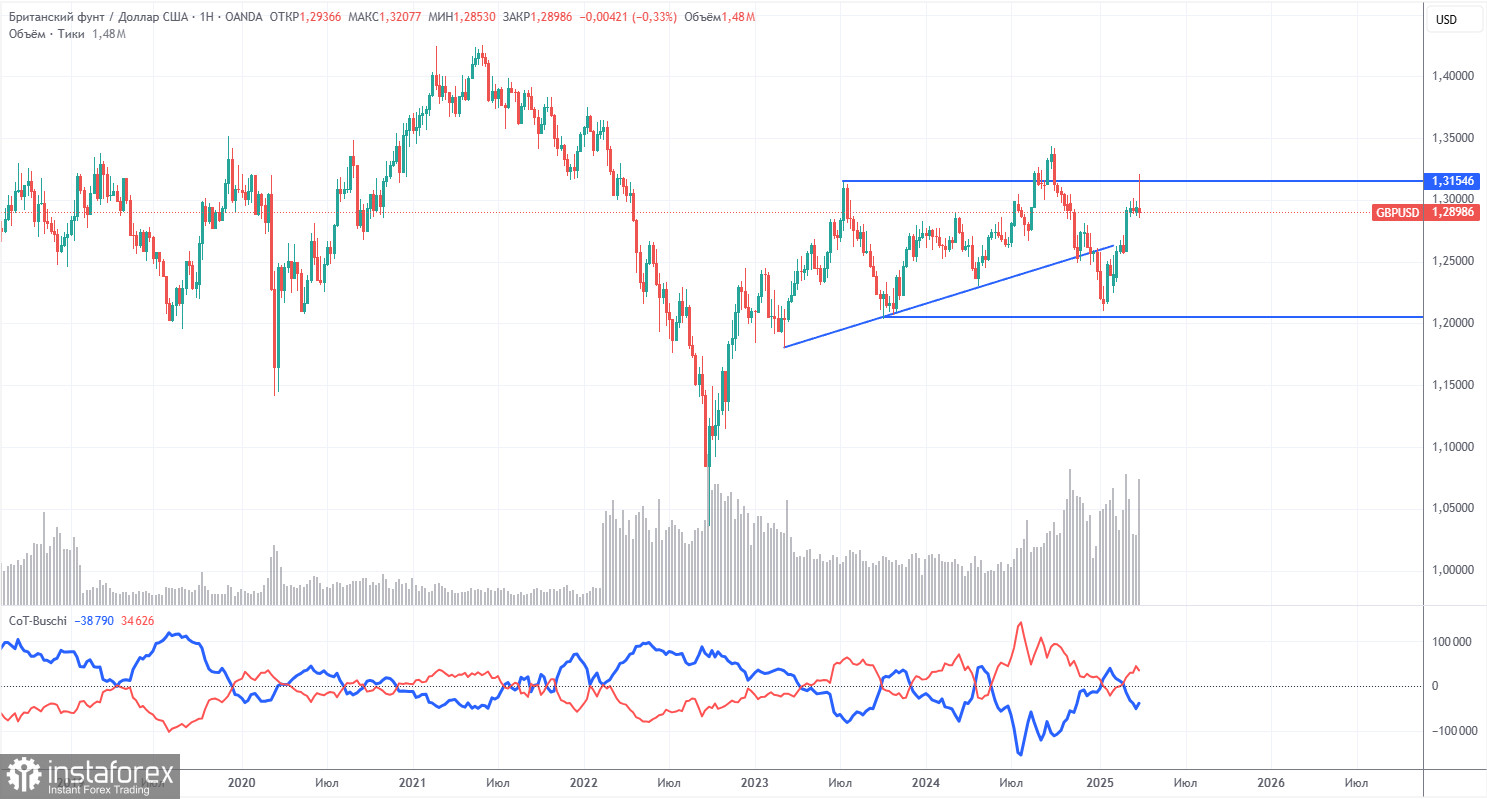
COT reports for the British pound show that sentiment among commercial traders has been constantly shifting in recent years. The red and blue lines, which represent the net positions of commercial and non-commercial traders, frequently cross and mostly hover around the zero line. At present, they remain close together, indicating a relatively balanced number of long and short positions.
On the weekly timeframe, the price first broke through the 1.3154 level, then overcame the trend line, returned to 1.3154, and bounced off it. Breaking the trend line suggests a high probability that the pound's decline will continue. The bounce from 1.3154 increases the likelihood of this scenario. Once again, the weekly chart looks as though the pound is preparing to move south.
According to the latest report on the British pound, the "Non-commercial" group closed 4,000 long contracts and opened 5,600 short contracts. As a result, the net position of non-commercial traders fell by 9,600 contracts.
The fundamental backdrop still provides no basis for long-term buying of the British pound, and the currency itself still has real potential to continue the global downtrend. The recent rally in the pound was driven by one factor alone — Donald Trump's policy.
GBP/USD 1-Hour Analysis
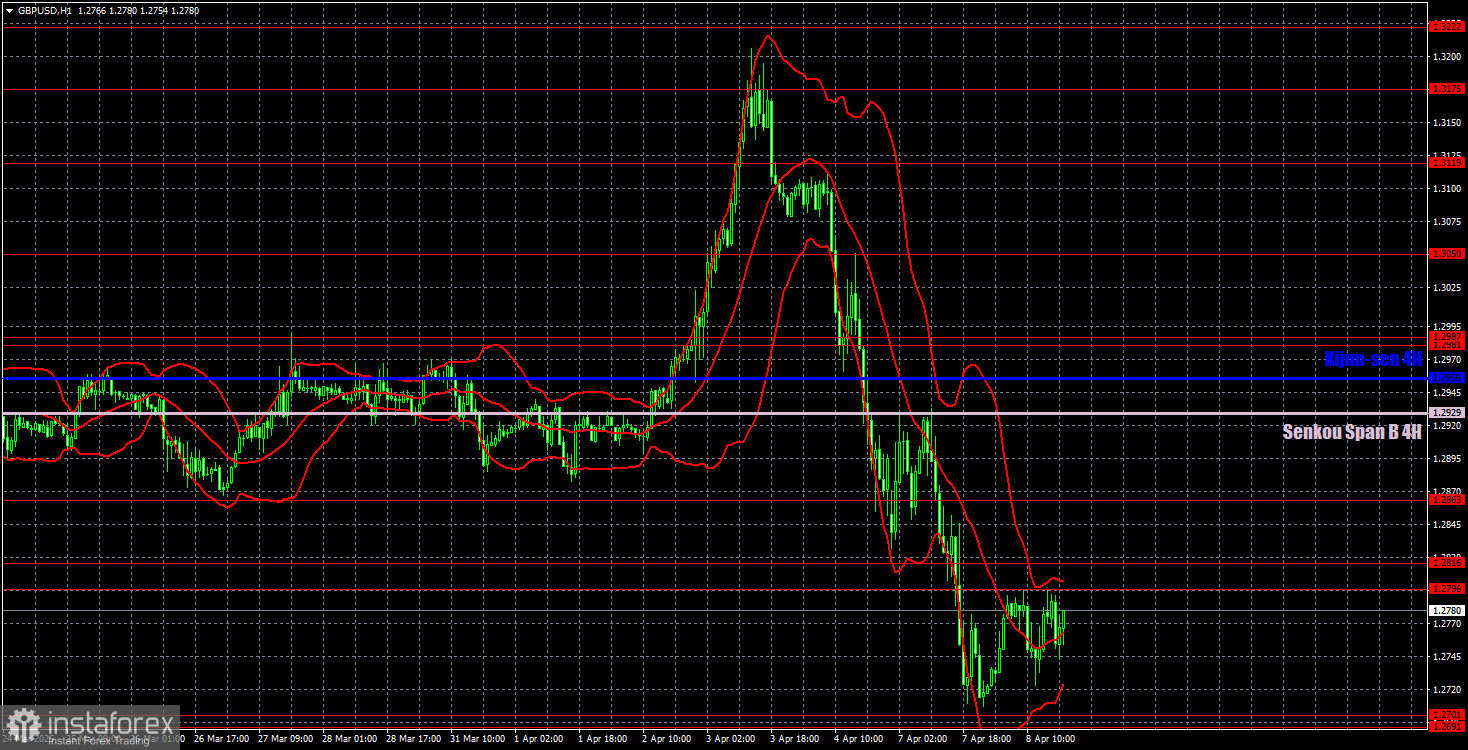
On the hourly timeframe, GBP/USD showed a strong rally after nearly a month of flat trading, followed by an even stronger collapse. Although the British pound had been rising for three months, it had little to do with its strength. The entire upward movement of the pound was driven by Donald Trump's weakening of the U.S. dollar. Currently, the pound is experiencing a sharp decline, which is difficult to explain using fundamentals or macroeconomic factors. But we won't be surprised if that drop ends tomorrow and the dollar resumes its decline.
For April 9, we highlight the following important levels: 1.2511, 1.2605–1.2620, 1.2691–1.2701, 1.2796–1.2816, 1.2863, 1.2981–1.2987, 1.3050, 1.3119, 1.3175, 1.3222, 1.3273, 1.3358. The Senkou Span B (1.2929) and Kijun-sen (1.2956) lines can also serve as potential signal levels. Moving the Stop Loss to breakeven once the price moves 20 pips in the right direction is recommended. Note that the Ichimoku indicator lines may shift throughout the day, which should be considered when identifying trading signals.
No macroeconomic reports are scheduled in the UK or the U.S. on Wednesday. However, Donald Trump could once again trigger market chaos, so it's far too early to relax.
Illustration Explanations:
- Support and Resistance Levels (thick red lines): Thick red lines indicate where movement may come to an end. Please note that these lines are not sources of trading signals.
- Kijun-sen and Senkou Span B Lines: Ichimoku indicator lines transferred from the 4-hour timeframe to the hourly timeframe. These are strong lines.
- Extreme Levels (thin red lines): Thin red lines where the price has previously bounced. These serve as sources of trading signals.
- Yellow Lines: Trendlines, trend channels, or any other technical patterns.
- Indicator 1 on COT Charts: Represents the net position size for each category of traders.