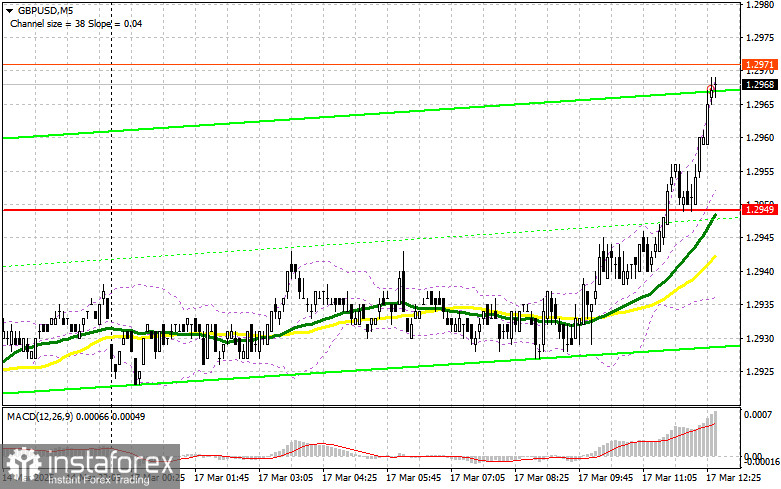
In my morning forecast, I highlighted 1.2949 as a key level for making market entry decisions. Let's analyze the 5-minute chart to see what happened. The price moved higher, but the retest of 1.2949 never materialized, so I was left without a trading opportunity. The technical outlook has been revised for the second half of the day.
To Open Long Positions on GBP/USD:
The pound continued its upward movement due to the absence of UK economic data, mirroring its behavior throughout last week, despite having ignored weak GDP and industrial production figures from last Friday.
For the second half of the day, only exceptionally strong U.S. retail sales and Empire Manufacturing Index data could apply pressure on the pair. Otherwise, we are likely to see another test of the weekly high in the near term.
Given the bullish market, the best approach is to buy on pullbacks. A good entry level is 1.2947, which formed after the European session. A false breakout at this level would provide a strong buying signal, targeting a rise to resistance at 1.2984 (weekly high). A break above this level, followed by a retest from the upside, would generate a new buying opportunity, pushing the price toward 1.3028, further reinforcing the bullish trend.
The ultimate target would be 1.3068, where I will take profits.
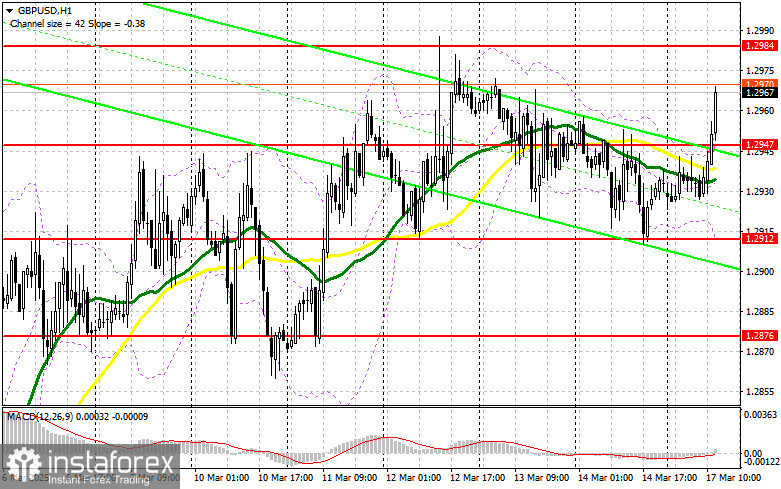
If GBP/USD declines and bulls fail to show activity at 1.2947, bearish pressure on the pound will increase. However, sellers will likely achieve only a small correction. A false breakout around 1.2912 would provide an ideal buying opportunity. If the pair continues to fall, I will buy on a rebound from 1.2876, aiming for a 30-35 point intraday correction.
To Open Short Positions on GBP/USD:
Sellers are not taking advantage of high prices, allowing bulls to dictate market movement. In the second half of the day, the focus will shift to defending the 1.2984 resistance level, which will be tested if U.S. data disappoints.
A false breakout at this level would provide an entry point for short positions, targeting a decline toward 1.2947. A break below this level, followed by a retest from below, would trigger stop-loss orders, opening the way for a drop to 1.2912, which would mark a significant correction.
The final bearish target is 1.2876, where I will lock in profits. A test of this level could halt the bullish trend.
If demand for the pound remains strong in the second half of the day and bears fail to act at 1.2984, I will delay short positions until the next resistance level at 1.3028, where I will sell only after an unsuccessful breakout attempt. If the pair fails to decline from this level, I will look for short positions near 1.3068, aiming for a 30-35 point pullback.
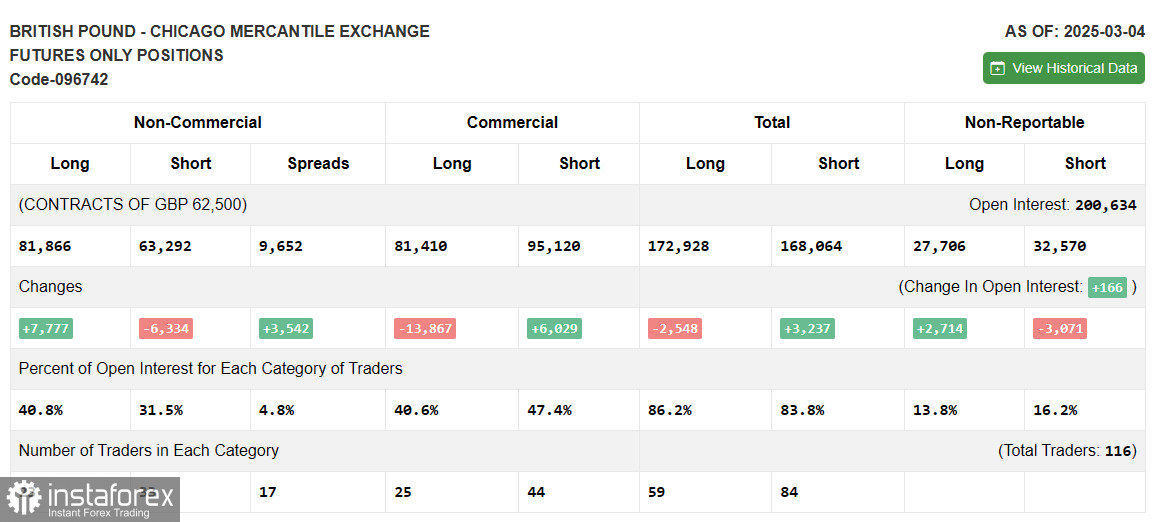
COT (Commitments of Traders) Report – March 4:
The latest COT report showed a slight increase in long positions and a decline in short positions, confirming a growing advantage for buyers, which supports further GBP/USD appreciation.
Given the positive economic trends in the UK and the Bank of England's cautious approach to rate cuts, GBP/USD may continue rising. However, corrections are inevitable, and traders should be prepared for potential pullbacks before new highs are reached.
According to the COT data, non-commercial long positions increased by 7,777 to 81,866, while short positions decreased by 6,334 to 63,292. As a result, the gap between long and short positions widened by 3,542.
Indicator Signals:
Moving Averages: The pair is trading above the 30-day and 50-day moving averages, confirming a bullish trend continuation.
Bollinger Bands: If the price declines, the lower Bollinger Band near 1.2912 will act as support.
Indicator Descriptions:
- Moving Average (MA) – Identifies the current trend by smoothing market volatility.
- 50-period MA (yellow line)
- 30-period MA (green line)
- MACD (Moving Average Convergence/Divergence)
- Fast EMA – 12-period
- Slow EMA – 26-period
- SMA – 9-period
- Bollinger Bands – Measures market volatility. 20-period setting used.
- Non-commercial traders – Speculators such as individual traders, hedge funds, and institutions using the futures market for speculation.
- Non-commercial long positions – The total number of long contracts held by non-commercial traders.
- Non-commercial short positions – The total number of short contracts held by non-commercial traders.
- Net non-commercial position – The difference between short and long positions among non-commercial traders.