On Wednesday, the GBP/USD currency pair openly traded in a flat range. Volatility remains low, with no trending movements even within the day. In other words, the market is simply stagnant. Notably, traders continue to ignore nearly all macroeconomic and fundamental data. For example, it was revealed yesterday that inflation in the UK dropped to 2.8% and core inflation to 3.5%—both below expectations. What do these reports indicate? They suggest that inflation in the UK isn't as bad as Bank of England Governor Andrew Bailey warned last week. Falling inflation means the BoE may lean slightly more dovish in the near term, and the pound, which had surged for no apparent reason, could at least begin to correct.
However, nothing of the sort happened during the European session. European traders ignored the inflation data, paying no attention whatsoever. So how, even theoretically, can the U.S. dollar appreciate if an important report triggers a 30–40 pip drop in the pound, but the next day—despite no news—the pound randomly rises?
The key takeaway for traders right now is that fundamentals and macroeconomics are not driving logical movements. As a result, even next week—when key U.S. reports on unemployment, business activity, and the labor market are released—the dollar may still struggle to gain ground.
We believe that, under current conditions, only two things can trigger a strengthening of the U.S. dollar:
- The market ends its dollar sell-off, concluding that enough is enough. No matter what tariffs or sanctions Donald Trump imposes, the U.S. economy has not seen a significant decline yet. However, the markets have already accounted for all possible Fed easing measures intended to "rescue" the economy.
- Donald Trump halts tariff implementation or begins reversing them. Nothing prevents the parties from negotiating. If agreements are reached, the dollar could start to recover, as its main pressure factor would be removed. The decline of the dollar has been driven entirely by Trump's tariff actions. If this factor is removed from the equation, markets will no longer have a reason to sell the greenback.
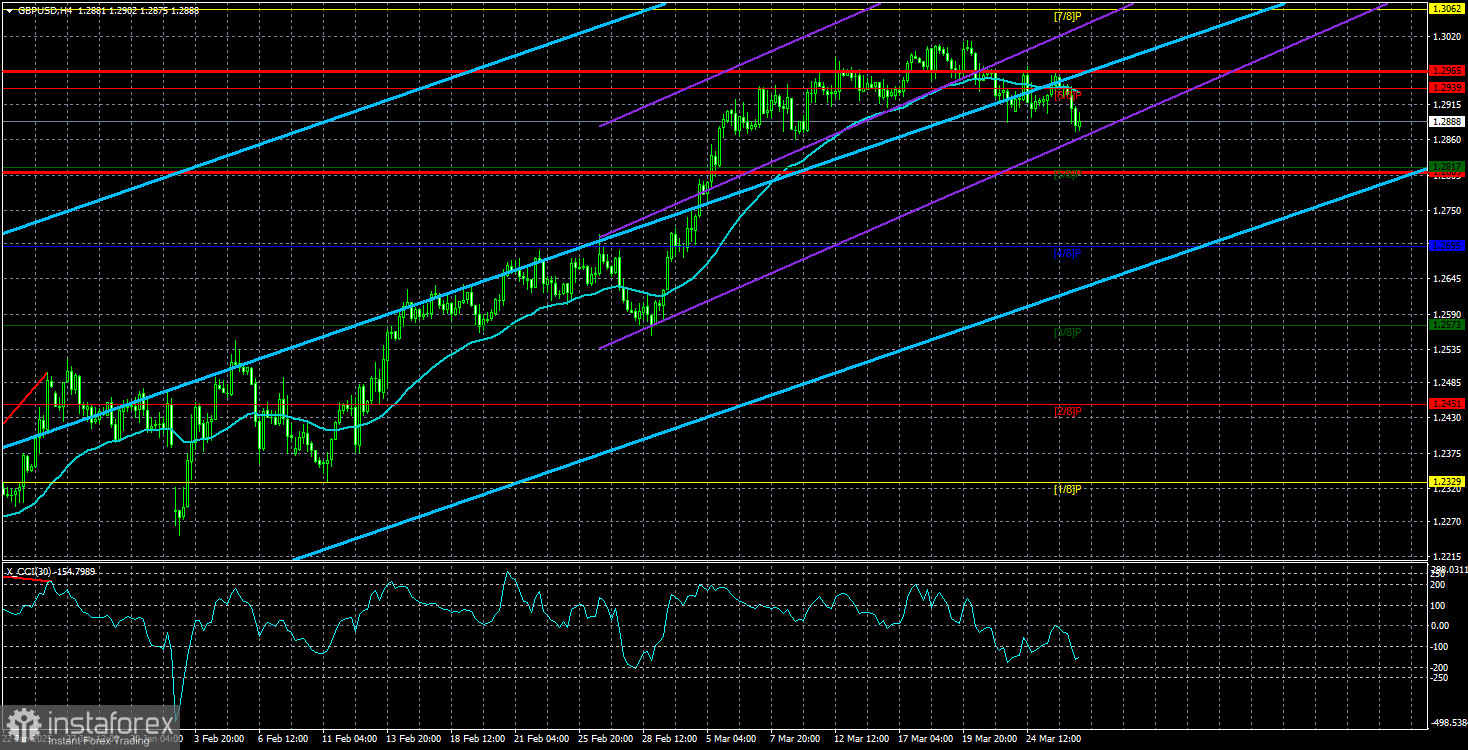
From a technical perspective, there's nothing new to report. The pair has been range-bound for several consecutive days. On the daily timeframe, GBP/USD is at critical levels—either the correction ends, or the movement turns into a new uptrend. However, we still see no justification for a long-term bullish trend that should logically last several years.
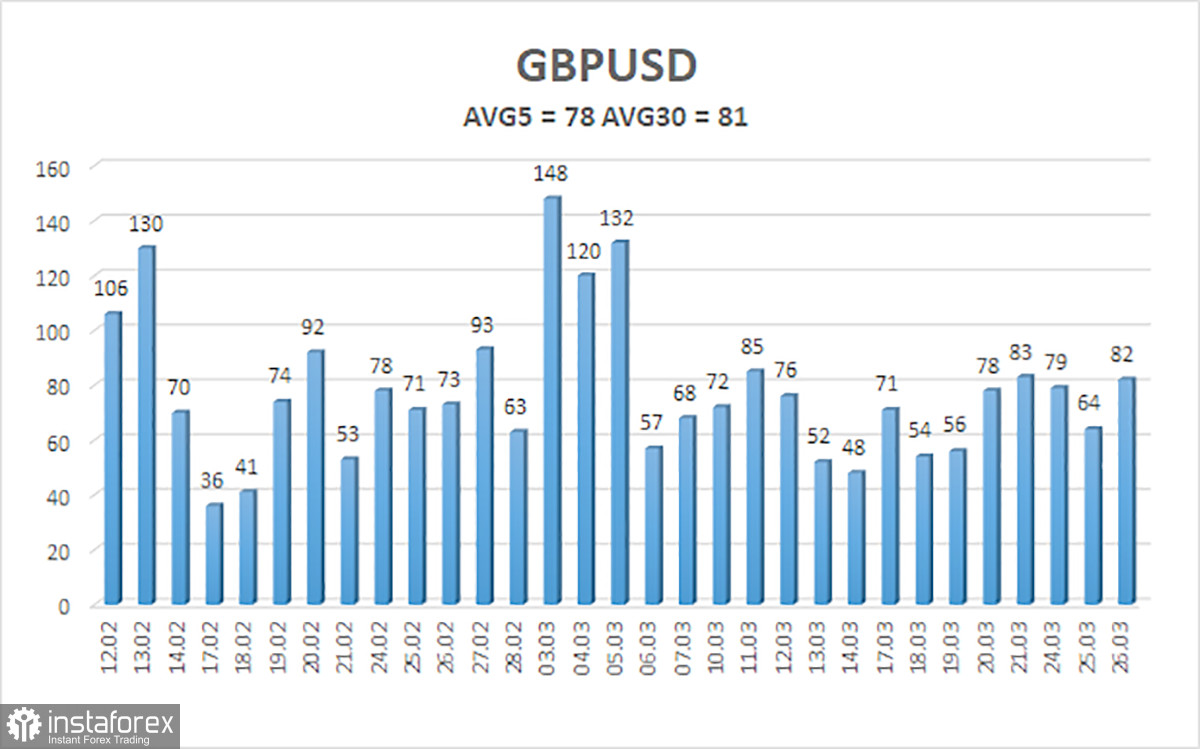
The average volatility of the GBP/USD pair over the last five trading days is 78 pips, which is considered "moderate-low" for this currency pair. On Thursday, March 27, we expect movement within the range of 1.2809 and 1.2965. The long-term regression channel has turned upward, but the downtrend remains intact on the daily timeframe. The CCI indicator has not recently entered overbought or oversold territory.
Nearest Support Levels:
S1 – 1.2817
S2 – 1.2695
S3 – 1.2573
Nearest Resistance Levels:
R1 – 1.2939
R2 – 1.3062
R3 – 1.3184
Trading Recommendations:
The GBP/USD pair maintains its medium-term bearish trend, while a weak correction has begun on the 4-hour chart. This correction could end anytime as the market continues to avoid dollar purchases. We still do not consider long positions, as the current upward move appears to be a correction on the daily chart that has turned into an irrational, panic-driven rally. However, if you trade purely on technicals, long positions are viable with targets at 1.2965 and 1.3062, provided the price stays above the moving average. Short positions remain attractive with targets at 1.2207 and 1.2146 because sooner or later, the upward correction on the daily chart will end (unless the prior downtrend ends first). The pound appears extremely overbought and unjustifiably expensive, and Donald Trump cannot devalue the dollar indefinitely. However, predicting how long this Trump-driven dollar decline will continue is extremely difficult.
Explanation of Illustrations:
Linear Regression Channels help determine the current trend. If both channels are aligned, it indicates a strong trend.
Moving Average Line (settings: 20,0, smoothed) defines the short-term trend and guides the trading direction.
Murray Levels act as target levels for movements and corrections.
Volatility Levels (red lines) represent the likely price range for the pair over the next 24 hours based on current volatility readings.
CCI Indicator: If it enters the oversold region (below -250) or overbought region (above +250), it signals an impending trend reversal in the opposite direction.