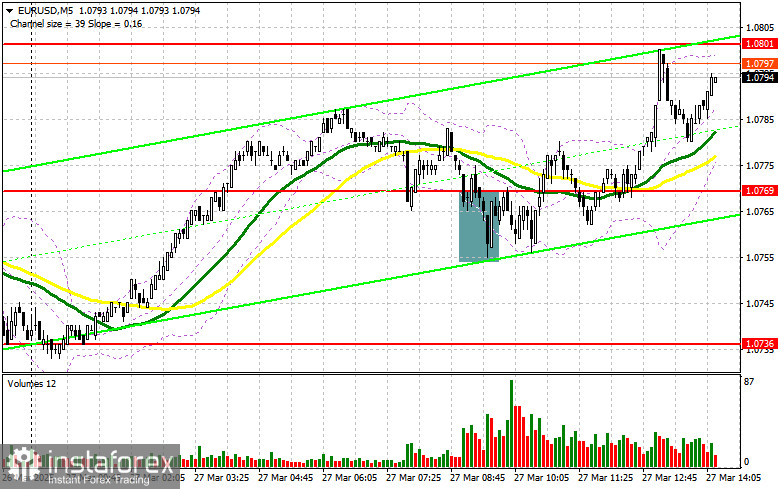
In my morning forecast, I focused on the 1.0769 level and planned to make trading decisions based on it. Let's take a look at the 5-minute chart and see what happened. The pair declined and formed a false breakout around 1.0769, which allowed for entry into long positions, but no significant upward movement followed. The technical picture for the second half of the day remains unchanged.
To open long positions on EUR/USD:
Considering that all bearish attempts to pressure the euro have failed, there is a chance for the pair to recover in the second half of the day — but this will require weak U.S. data. Lending figures from the eurozone were relatively decent, which also helped the euro recover slightly. During the U.S. session, only a significant downward revision of final Q4 U.S. GDP data will trigger new euro purchases and dollar sales. Additionally, the release of the core Personal Consumption Expenditures (PCE) index and weekly jobless claims will draw even more attention. FOMC member Thomas Barkin's speech will wrap up the day.
If the euro drops again, only a false breakout around the 1.0769 support — which acted as resistance earlier today — will provide a reason to buy EUR/USD in anticipation of a bullish trend, with the target of retesting 1.0801. A breakout and retest of this range from above will confirm the correct entry point for buying, with a move toward 1.0830. The final target will be the 1.0860 area, where I will take profit.
If EUR/USD drops and shows no signs of bullish activity around 1.0769 (which is more likely), the pair may continue to correct lower. In that case, only a false breakout around 1.0736 will justify buying the euro. I plan to open long positions immediately on a rebound from 1.0691 with a short-term correction target of 30–35 points.
To open short positions on EUR/USD:
Sellers have stepped aside for now after yesterday's sell-off triggered by Donald Trump's tariff announcements. Only very strong U.S. GDP and labor market data can bring back demand for the dollar. A false breakout around 1.0801 will allow short positions to be opened with a target at the 1.0769 support level, where the moving averages currently support the sellers. A breakout and consolidation below this range will open the way toward 1.0736. The final target will be 1.0691, where I plan to take profit.
If EUR/USD moves higher during the second half of the day and bears do not act around 1.0801, buyers may push the pair further up. In that case, I will delay short positions until a test of the next resistance at 1.0830. I will sell there only after a failed consolidation. If there is no downward movement from that level either, I will look for shorts around 1.0860, targeting a 30–35 point correction.
COT (Commitment of Traders) Report:
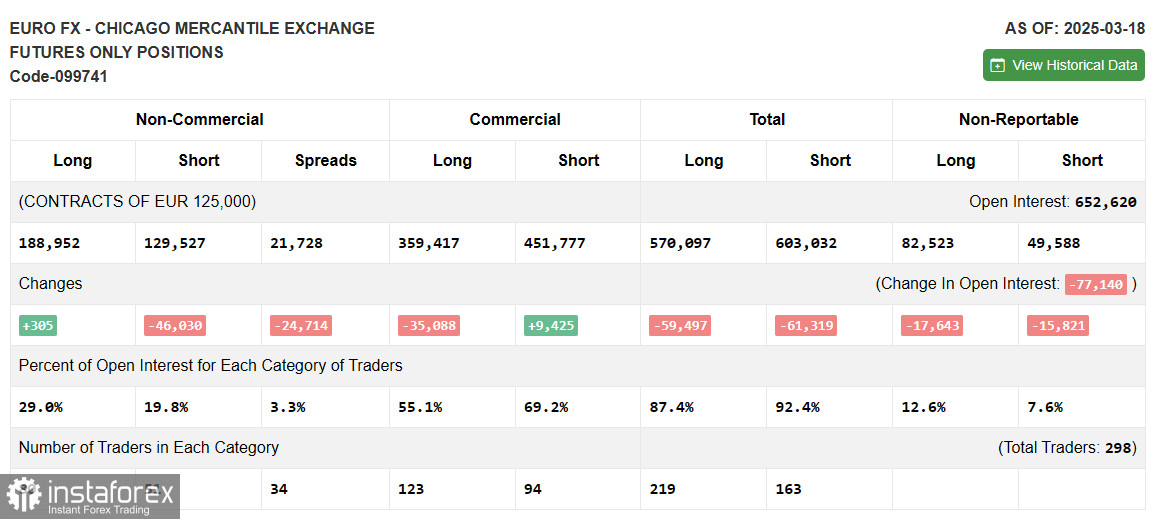
The March 18 COT report showed an increase in long positions and a significant reduction in shorts. Interest in buying the euro is growing, while sellers continue to exit the market. The ECB's cautious stance on rate cuts and weak U.S. fundamentals, pushing the Fed toward a more dovish policy, are shifting market sentiment.
According to the COT report, long non-commercial positions rose by 305 to 188,952 and short non-commercial positions fell by 46,030 to 129,527. The gap between longs and shorts narrowed by 24,714
Indicator Signals:
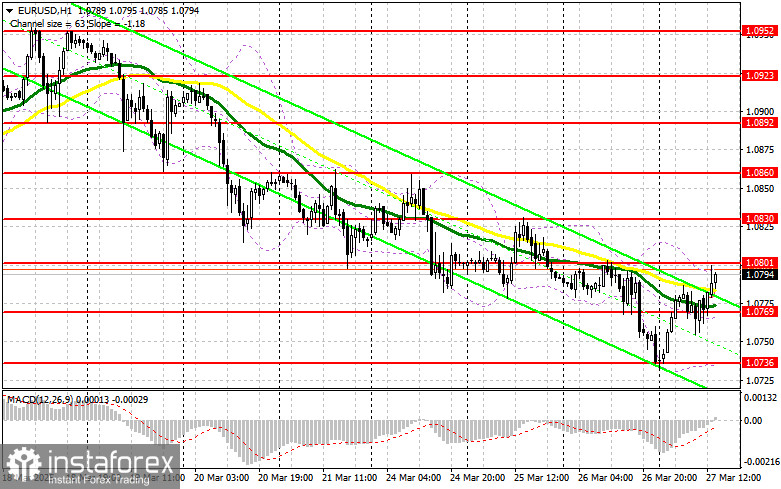
Moving Averages Trading is occurring near the 30- and 50-period moving averages, indicating a sideways market.
Note: The author uses H1 chart periods and prices, which differ from classic daily moving averages on D1.
Bollinger Bands In case of a decline, the lower boundary of the indicator around 1.0736 will act as support.
Indicator Descriptions:
- Moving Average (MA): Smooths price fluctuations to define the current trend. Period 50 (yellow), Period 30 (green).
- MACD (Moving Average Convergence/Divergence): Fast EMA – 12, Slow EMA – 26, Signal line (SMA) – 9.
- Bollinger Bands: Period 20.
- Non-commercial traders: Speculators such as individual traders, hedge funds, and large institutions trading futures for speculative purposes.
- Long non-commercial positions: Total long open positions held by non-commercial traders.
- Short non-commercial positions: Total short open positions held by non-commercial traders.
- Net non-commercial position: Difference between short and long positions held by non-commercial traders.