GBP/USD 5-Minute Analysis
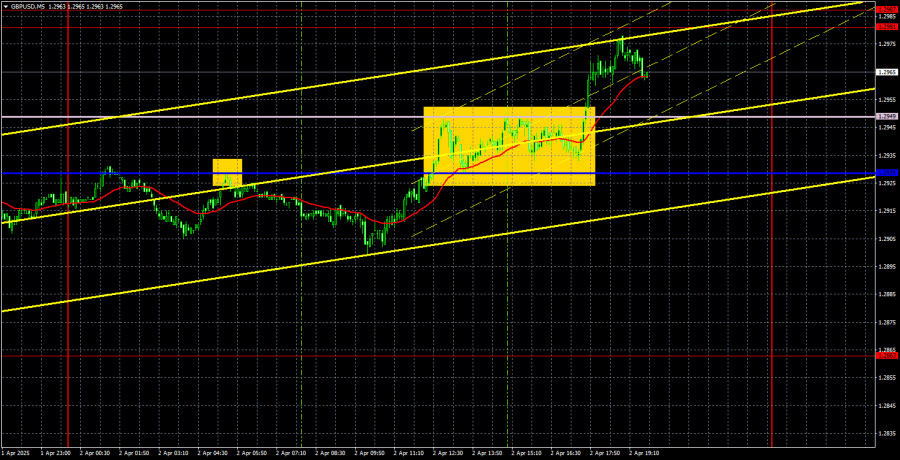
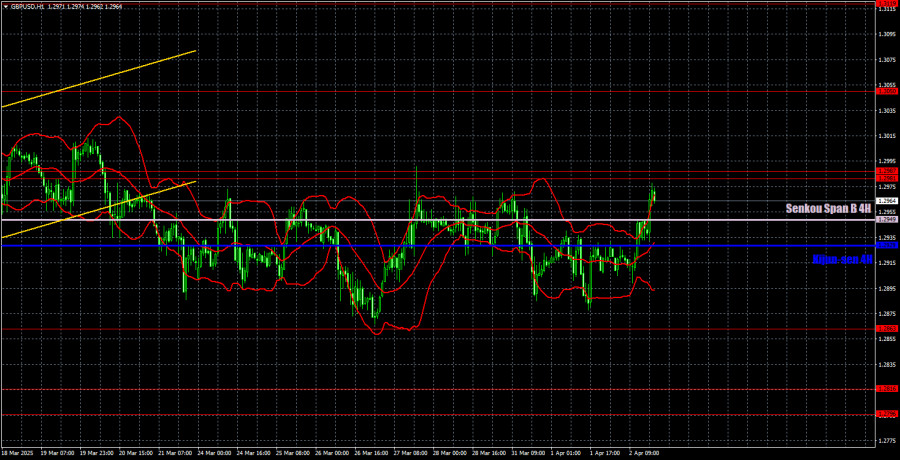
The GBP/USD currency pair continued to trade within a sideways channel on Wednesday. Over the past two weeks, all price movement has occurred between the 1.2863 and 1.2981 levels. The Ichimoku indicator lines are being ignored during this range-bound phase. The macroeconomic backdrop is irrelevant because the price is moving sideways. As a result, the technical picture of the pound appears "super-attractive." Of course, the market occasionally reacts to individual reports, but these moves are so weak that they're practically useless to trade—and predicting which report will spark a reaction is impossible.
There were no notable events in the UK yesterday, and in the U.S., the ADP employment report (the "little brother" of NonFarm Payrolls) was released. As we warned, the market paid no attention to this report. According to ADP, 155,000 new jobs were created in March, compared to a forecast of 105,000. How much has the U.S. dollar increased? Correct—there has been no change at all. The market spent the entire day awaiting Donald Trump's speech, but no information was released by the end of the day. As a reminder, we do not recommend trading on "super-important" news or events and not leaving positions open overnight. Of course, everyone has their trading strategy, and trades are not only open during the day. However, in any case, we wouldn't trade "on Trump"—the risk is just too high.
Technically, two trading signals were formed during the day. The price bounced back from the critical line overnight and fell by 20 pips, which was at least enough to set a Stop Loss to breakeven. Later in the day, the price crossed the Senkou Span B and Kijun-sen lines and eventually reached the 1.2981 level. Nonetheless, all daily movements still occurred within the flat range.
COT Report
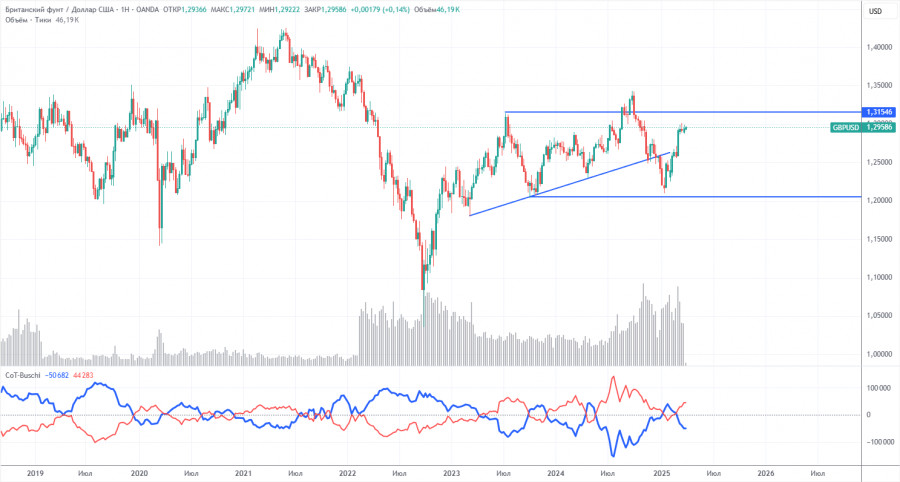
The COT reports for the British pound show that commercial traders' sentiment has constantly shifted in recent years. The red and blue lines, which reflect the net positions of commercial and non-commercial traders, frequently cross and usually stay close to the zero line. They are again near each other, indicating a roughly equal number of long and short positions.
On the weekly timeframe, the price first broke through the 1.3154 level and then dropped to the trendline, which it successfully breached. Breaking the trendline suggests a high probability of further GBP decline. However, the bounce from the previous local low on the weekly timeframe is also worth noting. We may be looking at a broad flat.
According to the latest COT report for the British pound, the "Non-commercial" group opened 13,000 new long contracts and closed 1,800 short contracts. As a result, the net position of non-commercial traders rose again—by 14,800 contracts.
The fundamental background still provides no grounds for long-term GBP purchases, and the currency remains vulnerable to continuing the global downtrend. The pound has risen significantly recently, and the primary reason for this increase is Donald Trump's policy.
GBP/USD 1-Hour Analysis
In the hourly timeframe, GBP/USD remains completely flat (sideways market), and the upward correction on the daily chart is long overdue for completion. We still don't see what would support the British pound in a long-term uptrend. The only thing still working in favor of the pound is Donald Trump, who's imposing tariffs and sanctions left and right. Even though that factor is starting to wear thin with the market, the flat must end before a new trend can be determined on the hourly chart.
For April 3, we highlight the following key levels: 1.2331–1.2349, 1.2429–1.2445, 1.2511, 1.2605–1.2620, 1.2691–1.2701, 1.2796–1.2816, 1.2863, 1.2981–1.2987, 1.3050, 1.3119. The Senkou Span B line (1.2949) and Kijun-sen line (1.2929) can also serve as signal levels. A Stop Loss should be moved to breakeven once the price moves 20 pips in the desired direction. Ichimoku indicator lines can shift during the day, so this must be considered when identifying signals.
On Thursday, service sector activity indices will be published in the UK and the U.S., with the S&P and ISM versions being released in the U.S. Honestly if the market couldn't break out of the sideways channel "on Trump," we don't expect Thursday's macroeconomic data to break the flat either. There might be a small intraday reaction, but it's unlikely to have any practical impact.
Illustration Explanations:
- Support and Resistance Levels (thick red lines): Thick red lines indicate where movement may come to an end. Please note that these lines are not sources of trading signals.
- Kijun-sen and Senkou Span B Lines: Ichimoku indicator lines transferred from the 4-hour timeframe to the hourly timeframe. These are strong lines.
- Extreme Levels (thin red lines): Thin red lines where the price has previously bounced. These serve as sources of trading signals.
- Yellow Lines: Trendlines, trend channels, or any other technical patterns.
- Indicator 1 on COT Charts: Represents the net position size for each category of traders.


