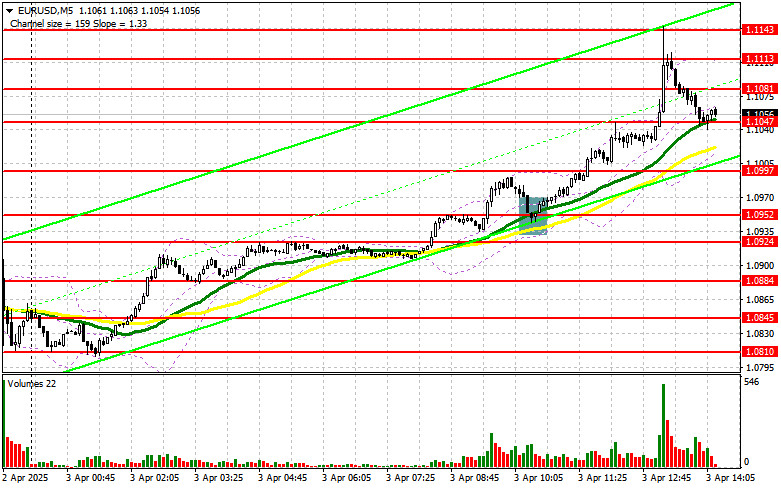
In my morning forecast, I highlighted the 1.0952 level and planned to make entry decisions from there. Let's look at the 5-minute chart and analyze what happened. A drop followed by a false breakout at that level created a strong long entry point, which resulted in a 100-point rally for the euro. The technical picture was revised for the second half of the day.
To open long positions on EUR/USD:
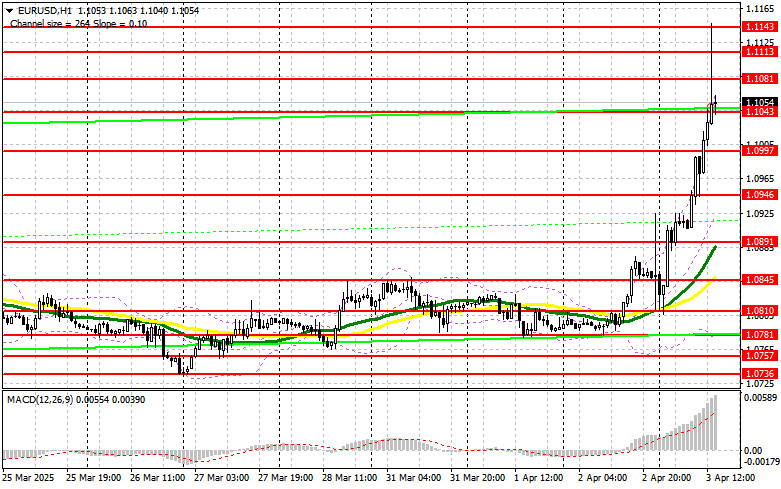
Active buying of the euro has led to an intraday strengthening of the EUR/USD pair by over 300 points — something we haven't seen in more than 10 years. Many banks have already revised their short-term forecasts, targeting the 1.15 area, which triggered even more aggressive buying. It's likely that stop orders above the psychological level of 1.10 also fueled the surge during the European session.
During the U.S. session, several reports will be released, including weekly jobless claims and the trade balance. ISM services PMI data is also expected. Only exceptionally strong figures from the U.S. — possibly the last of their kind due to Trump's new tariffs — could help the dollar rebound.
If the euro dips after the reports, a false breakout around the 1.1043 support will be a signal to buy EUR/USD again, aiming to maintain bullish momentum with a target at 1.1113. A breakout and retest of this area from above will confirm a proper entry into long positions, with the next target at 1.1143. The ultimate target will be 1.1179, where I will lock in profits.
If EUR/USD drops and there's no bullish activity near 1.1043, euro pressure will intensify. In that case, bears could push the pair down to 1.0997. Only a false breakout there would justify new long positions. Otherwise, I plan to buy on a rebound from 1.0946, targeting a 30–35 point intraday correction.
To open short positions on EUR/USD:
Sellers are in shock, so jumping into short positions today against such a strong bull market is not advisable. In the event of a negative market reaction to the U.S. ISM data, only a false breakout near the 1.1143 resistance would allow a short entry, targeting support at 1.1081. A breakout and consolidation below this level would open the door for a further drop to 1.1043. The final target would be 1.0997, where I plan to take profit.
If EUR/USD continues rising in the second half of the day — which is more likely — and bears show no resistance at 1.1143, buyers may drive the pair even higher. In that case, I'll postpone shorts until a test of the next resistance at 1.1179. I will consider selling only after a failed breakout there. If no downward movement appears at that level either, I'll look for a bounce short entry at 1.1213, targeting a 30–35 point downward correction.
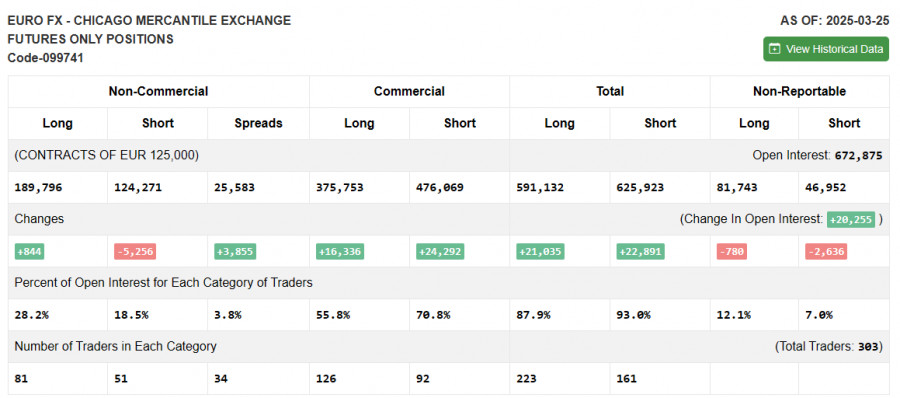
COT (Commitment of Traders) Report – March 25:
The report showed a slight increase in long positions and a strong reduction in shorts. There are not significantly more euro buyers, but sellers continue exiting the market. Based on recent inflation data in the eurozone and ECB officials' comments, the central bank is likely to keep its current policy unchanged in April, which could temporarily support the euro.
However, the real impact depends on how severely U.S. tariffs affect other countries. The greater the threat of a global economic slowdown, the stronger the pressure will be on risk assets — including the euro. The COT report shows that non-commercial long positions rose by 844 to 189,796, while short positions fell by 5,256 to 124,271. As a result, the net gap increased by 3,855.
Indicator Signals:
Moving Averages: Trading is above the 30- and 50-day moving averages, signaling the emergence of a new bull market for the euro.
Note: The author uses H1 hourly chart MAs, which may differ from classic daily chart definitions.
Bollinger Bands: If the pair declines, the lower band around 1.0891 will act as support.
Indicator Definitions:
- Moving Average (MA): Smooths out volatility and noise to define the current trend. Period – 50 (yellow), 30 (green).
- MACD (Moving Average Convergence/Divergence): Fast EMA – 12; Slow EMA – 26; SMA – 9.
- Bollinger Bands: Period – 20.
- Non-commercial traders: Speculators such as individual traders, hedge funds, and large institutions using the futures market for speculative purposes.
- Long non-commercial positions: Total long open interest held by non-commercial traders.
- Short non-commercial positions: Total short open interest held by non-commercial traders.
- Net non-commercial position: The difference between short and long positions.


