The GBP/USD currency pair also traded higher on Thursday. As a reminder, macroeconomic and traditional fundamental factors currently have little to no influence on currency movements. The only thing that matters now is the global trade war and related news. As noted in the EUR/USD article, Wednesday was packed with developments on this front. On Thursday, traders had time to assess Trump's "temporary truce" more rationally. And the market's response was clear: there is no truce—just a facade for the general public. The tariffs remain in effect; they were merely reduced to 10%. Even that raises certain questions.
Let's suppose we have the U.S. and a second country. According to Trump, there is some unfairness in trade relations. To balance the trade deficit, a 10% tariff might be reasonable. But Trump imposes a 30% tariff, waits a few days, and then—with a gracious expression—announces a 90-day grace period during which the tariff will be 10%. And the second country must try extra hard to satisfy the U.S. or face the return of the 30% rate. The point is that all the tariffs Trump and his team introduced seem to be pulled out of thin air. For instance, can anyone explain how the 125% tariff on China was calculated? Moreover, this figure has changed thrice in the past week.
Therefore, we maintain that Trump's actual tariff rates are irrelevant. They are simply a tool to pressure opponents into being more cooperative during negotiations. The higher the tariffs, the more likely the opponent will give in to Trump's demands. That's the whole logic. Trump bluffs, threatens and puts on a good face during a bad game. But this is all part of his well-known political playbook, which the world became familiar with four years ago.
As for the British pound, it remains a mere bystander in all of this. Everything now depends on Trump and the dollar, which only reacts to Trump. The dollar has been falling for three consecutive months. It has declined ever since Trump became president. Ironically, that might even work in his favor since a weaker dollar was one of his goals during his first term. But at the same time—as we've already mentioned—the world's sentiment toward the U.S. is far from favorable. And we're not just talking about governments but also ordinary people increasingly choosing not to buy American goods out of principle. Therefore, we strongly doubt that Trump's methods will significantly benefit the U.S. budget or economy. And they certainly won't help the dollar.
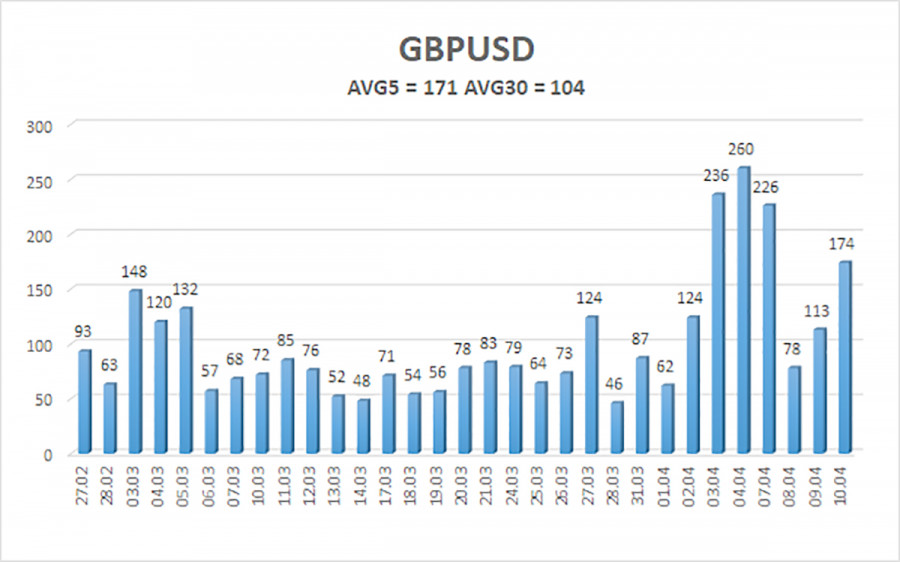
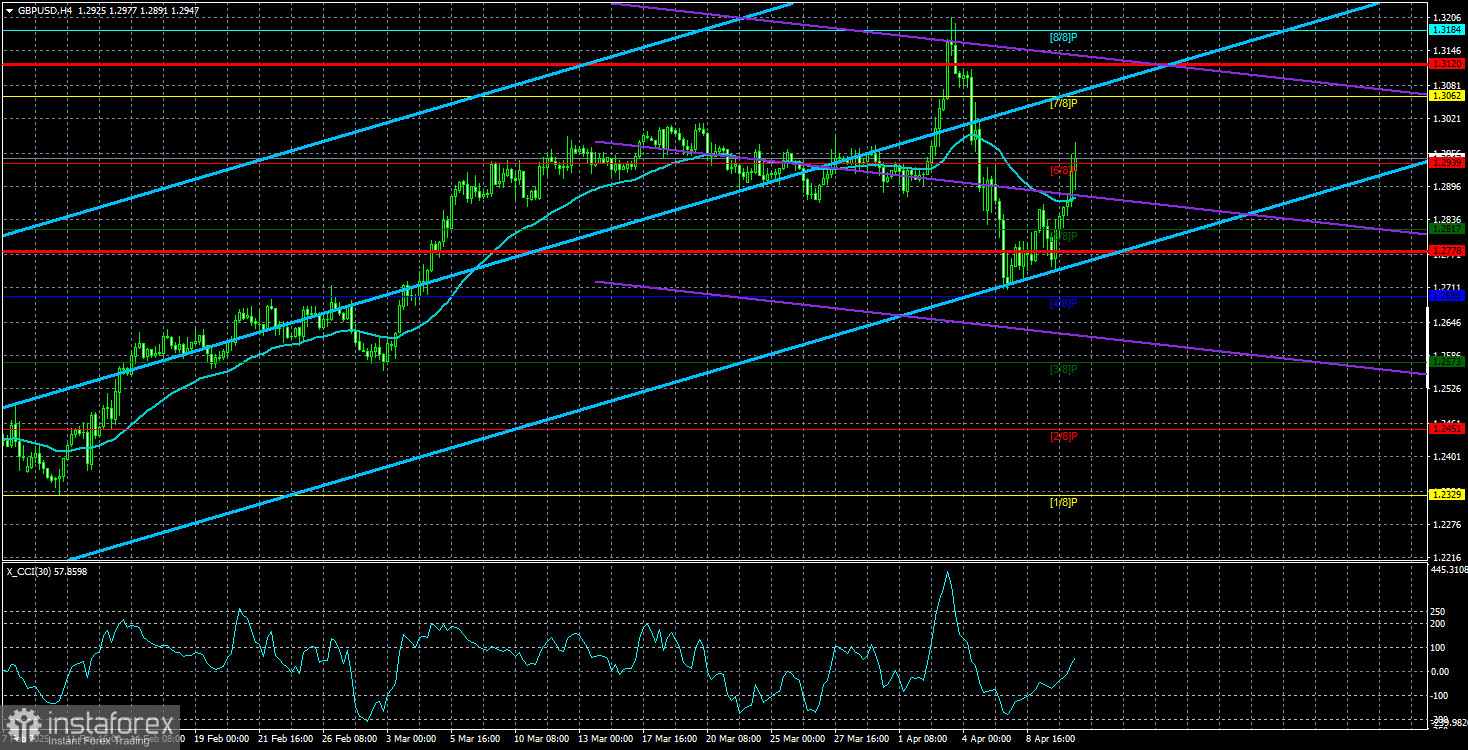
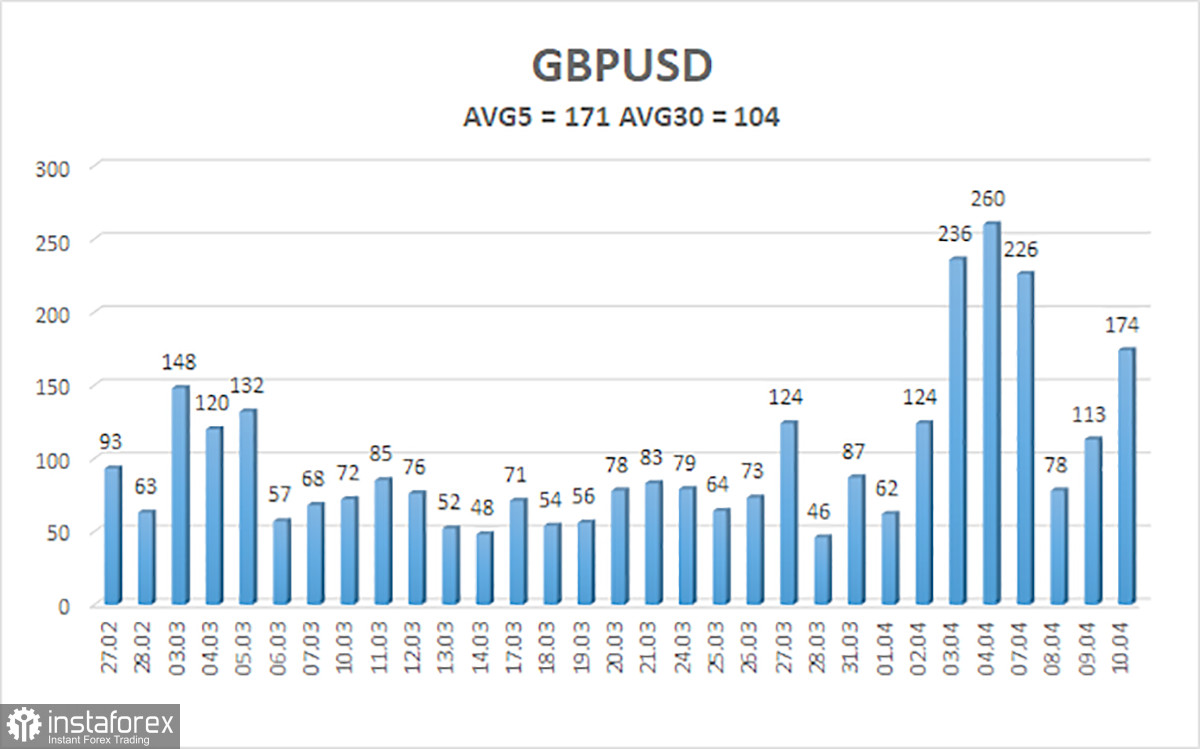
The average volatility of the GBP/USD pair over the last 5 trading days stands at 171 points, which is considered high. Therefore, on Friday, April 11, we expect the pair to move within a range limited by the levels 1.2778 to 1.3120. The long-term regression channel is pointed upward, but a downward trend is still present on the daily time frame. The CCI indicator entered overbought territory, indicating a downward correction, which now appears to have ended.
Nearest Support Levels:
S1 – 1.2817
S2 – 1.2695
S3 – 1.2573
Nearest Resistance Levels:
R1 – 1.2939
R2 – 1.3062
R3 – 1.3184
Trading Recommendations:
The GBP/USD pair began to fall sharply, but that decline is now over. We still do not recommend long positions, as we believe the recent upward movement is just a correction on the daily time frame that has already become illogical. However, if you're trading purely based on technical signals, longs remain valid with targets at 1.3062 and 1.3120 since the price is above the moving average.
Sell orders also remain attractive, targeting 1.2207 and 1.2146, because sooner or later, the upward correction on the daily chart will end (if the downtrend doesn't end before that). That said, with Trump introducing or raising tariffs nearly every day, the dollar keeps falling—and this could continue for some time.
Explanation of Illustrations:
Linear Regression Channels help determine the current trend. If both channels are aligned, it indicates a strong trend.
Moving Average Line (settings: 20,0, smoothed) defines the short-term trend and guides the trading direction.
Murray Levels act as target levels for movements and corrections.
Volatility Levels (red lines) represent the likely price range for the pair over the next 24 hours based on current volatility readings.
CCI Indicator: If it enters the oversold region (below -250) or overbought region (above +250), it signals an impending trend reversal in the opposite direction.