GBP/USD
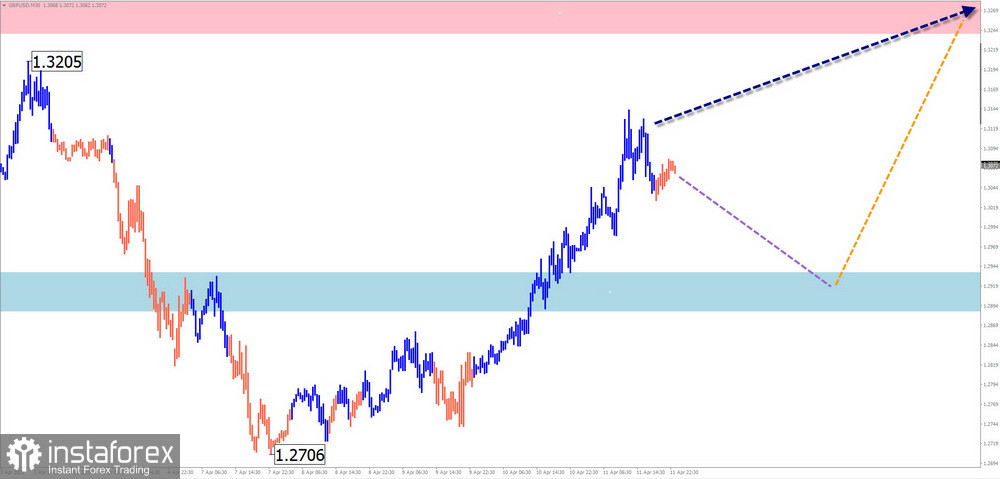
Analysis: On the higher time frame of the pound sterling's major pair, a bullish trend has been forming since July last year. Over the past month, an extended corrective flat (B) has developed within the wave structure. Quotes have reached the upper boundary of a potential reversal zone on the daily chart.
Forecast: Over the next couple of days, the pound is expected to move sideways. A pullback toward the support zone is possible, followed by a reversal and a resumption of the upward trend. The calculated resistance serves as the upper boundary for the week's expected price movement.
Potential Reversal Zones:
- Resistance: 1.3240 / 1.3290
- Support: 1.2940 / 1.2890
Recommendations:
- Selling: High-risk trades, likely to be unprofitable.
- Buying: May be considered after confirmed reversal signals appear near the support zone.
AUD/USD
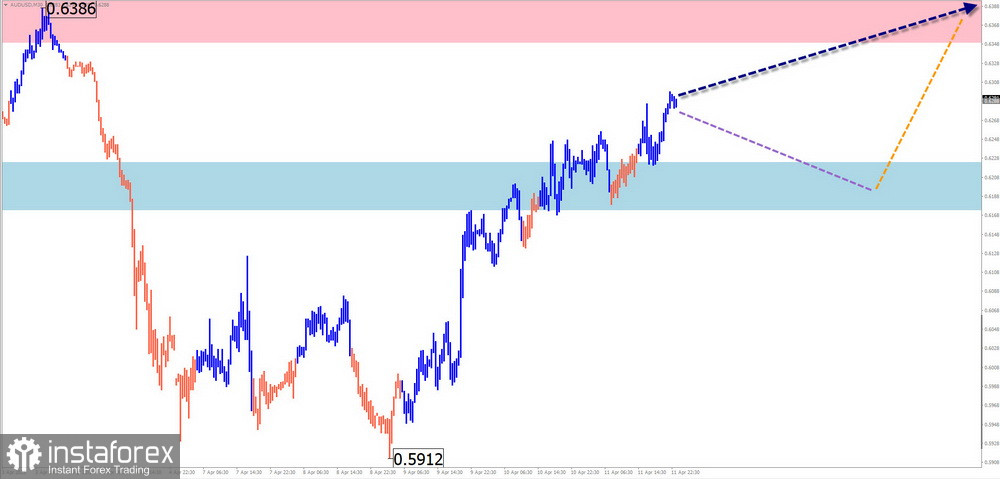
Analysis: Since September of last year, the main pair of the Australian dollar has followed a downward wave. On April 7, a wave with reversal potential began developing in the opposite direction. The structure is still incomplete, and the price is nearing a strong potential reversal zone on the daily chart.
Forecast: This week is likely to see a gradual move from the calculated support zone toward resistance. A short-term pullback to support may occur early in the week. A breakout beyond these boundaries during the week is unlikely.
Potential Reversal Zones:
- Resistance: 0.6360 / 0.6410
- Support: 0.6220 / 0.6170
Recommendations:
- Selling: High risk with low potential.
- Buying: Can be considered after confirmed reversal signals appear near support.
USD/CHF
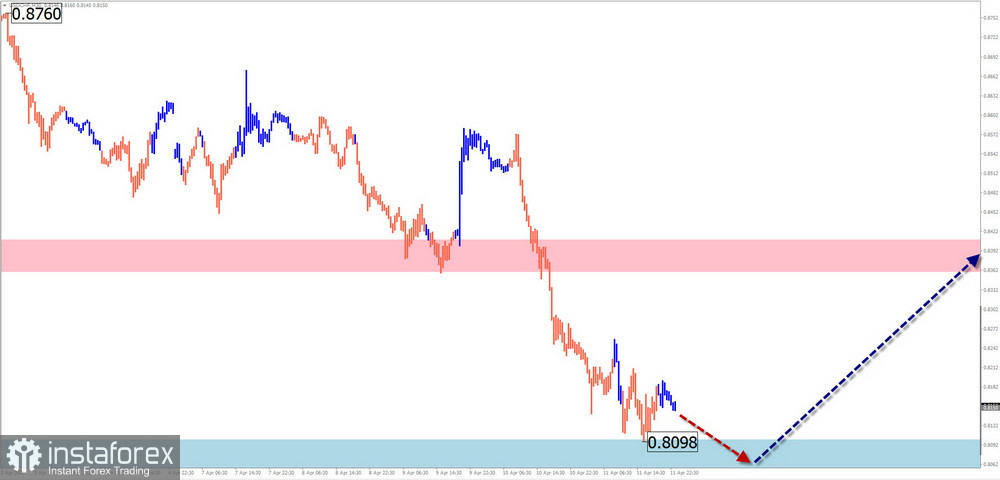
Analysis: In the short term, the wave in the Swiss franc has been downward since the beginning of this year. The wave is completing a larger bearish structure on the weekly chart and is now in its final phase. The calculated support zone lies at the lower boundary of a major potential reversal area.
Forecast: This week should bring the end of the downtrend and the beginning of a price recovery. A short-term pullback to support is possible in the next couple of days. A breakdown of the lower support boundary is unlikely. Most activity is expected toward the end of the week.
Potential Reversal Zones:
- Resistance: 0.8360 / 0.8410
- Support: 0.8100 / 0.8050
Recommendations:
- Selling: High risk, possibly unprofitable.
- Buying: Will become relevant once confirmed reversal signals appear near support.
EUR/JPY
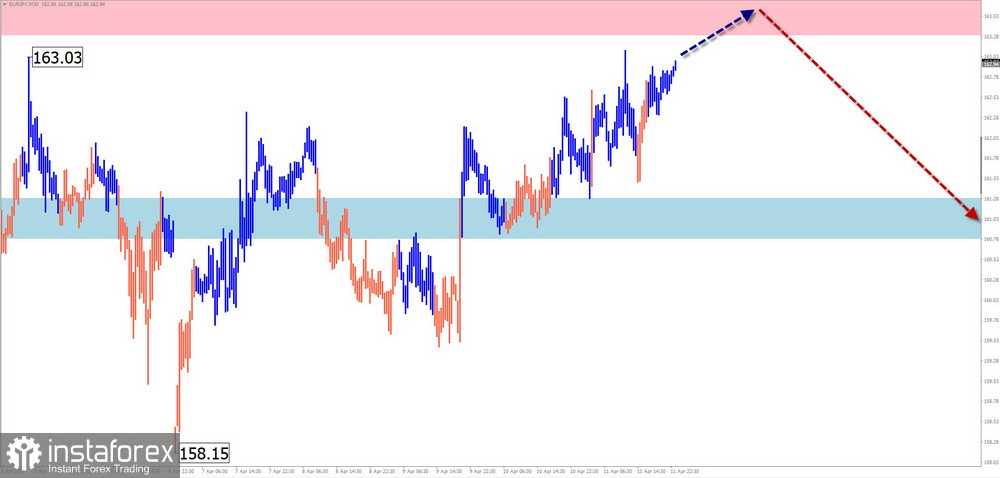
Analysis: In the short term, the euro/yen cross is dominated by an uptrend. The current incomplete segment is corrective and started on March 18. The price is within a major potential reversal zone, with several resistance levels from different time frames clustered nearby.
Forecast: Sideways price action is expected in the next day or two. The price may rise toward the resistance zone. Later in the week, volatility is likely to increase, potentially leading to a reversal and decline.
Potential Reversal Zones:
- Resistance: 163.30 / 163.80
- Support: 161.30 / 160.80
Recommendations:
- Buying: Can be done with reduced volume sizes in individual sessions; potential is limited.
- Selling: Once reversal signals appear near resistance, selling may become the primary trading strategy.
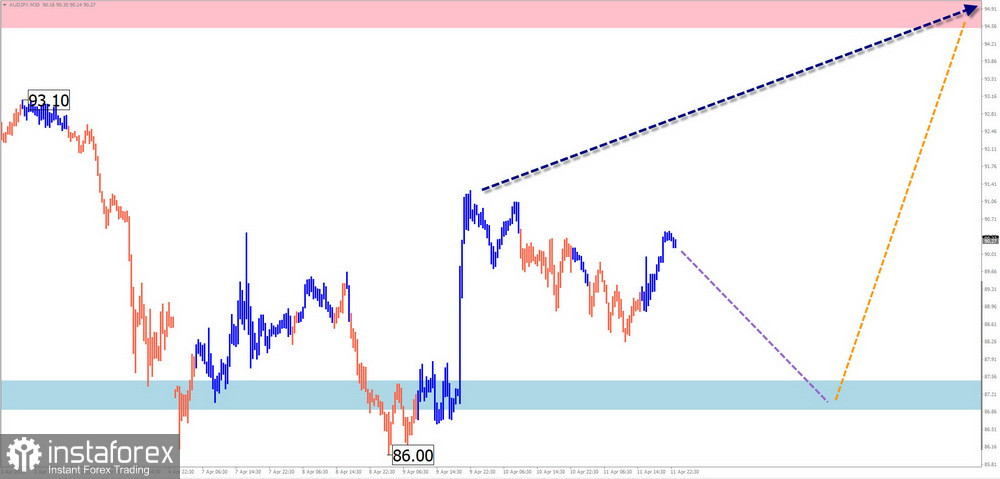
AUD/JPY
Analysis: The short-term wave structure of the Australian dollar/yen cross has been unfolding since June of last year and maintains an overall upward direction. The wave forms a contracting flat pattern, still missing its final segment (C). The price is at the upper edge of a strong weekly reversal zone.
Forecast: Early in the week, price movement is likely to be sideways along calculated support. Then, rising volatility and an upward move toward resistance can be expected.
Potential Reversal Zones:
- Resistance: 94.50 / 95.00
- Support: 87.50 / 87.00
Recommendations:
- Selling: Can be considered with reduced volume during specific sessions; potential is limited.
- Buying: Premature until confirmed reversal signals appear near support.
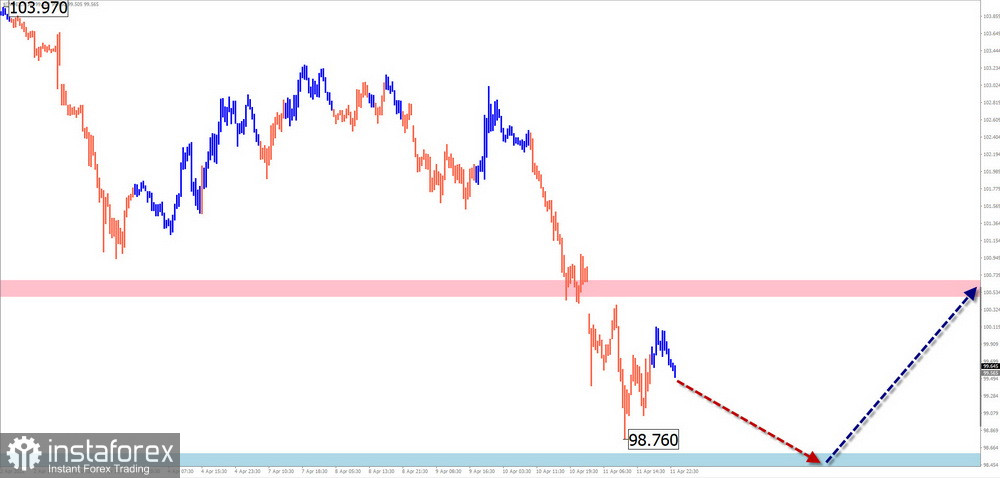
US Dollar Index ($Index)
Brief Analysis: Since December 3 of this year, the U.S. Dollar Index has followed a downward wave structure. The final segment (C) of the wave is forming. The calculated support zone lies at the upper edge of a major weekly reversal zone.
Weekly Forecast: The U.S. dollar's decline may conclude in the next couple of days. A transition to sideways movement is likely near the support zone, with a possible price recovery beginning later in the week.
Potential Reversal Zones:
- Resistance: 100.50 / 100.70
- Support: 99.40 / 99.20
Recommendations: The current period of dollar weakness and buying of national currencies in major pairs appears temporary. Selling national currencies (i.e., buying the dollar) may become the primary strategy once confirmed reversal signals appear near support.
Explanation: In Simplified Wave Analysis (SWA), all waves consist of three parts (A-B-C). The most recent incomplete wave is analyzed on each time frame. Expected movements are indicated with dashed lines.
Note: The wave algorithm does not account for the duration of price movements over time.