empty
02.09.2024 10:23 AM
GBP/USD: outlook on September 2

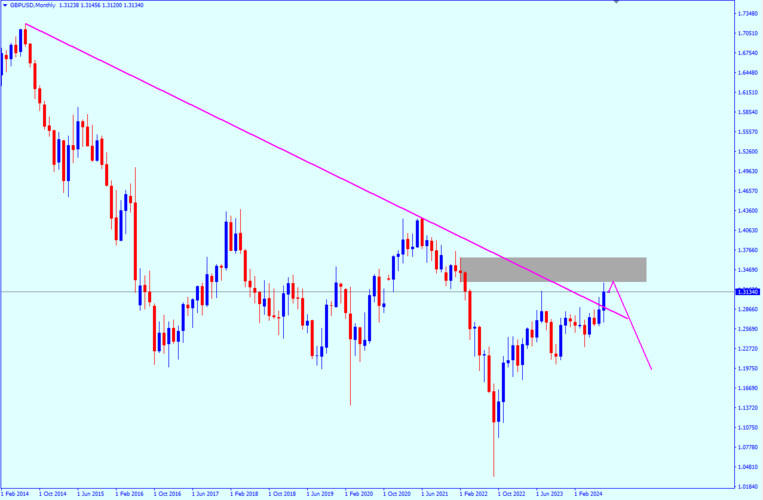
Monthly chart

In the monthly time frame, the GBP/USD pair broke a downtrend line that lasted for more than 10 years. However, this break could be false and GBP/USD will not be able to continue rising after this break. It is targeting liquidity above the trend line and will rebound from the order zone at 1.3280. From this area, we may see some bearish signals such as price action or a bearish structure.

This image is no longer relevant

Weekly chart

The weekly time frame also supports the decline because the trend is still bearish and there is an additional signal that supports the decline from the order block of 1.3488, which is the presence of an IDM before this level. The IDM is like liquidity that attracts traders to enter from areas before the real bounce happens, and the GBP/USD pair will target breaking the internal upward trend.

Daily chart

There are not many opportunities in the daily time frame, but there is a liquidity void, which is a sign that the pair needs to make some corrections before continuing the rise. This is actually a good sign to target the order block on the weekly time frame. To reach that order block, the instrument will bounce from 1.2871 (order block) or from the 61.8 Fibonacci level. These are considered important levels for the bounce, and then we will see a strong rise after that.

4-hour chart

If you want to enter a trade until the price reaches the appropriate areas in the daily time frame, there is a good area to enter sell from the level of 1.31642. This area is considered an order flow zone, as the price bounced from the order block above it, and then I expect it to do the same thing from this zone, especially since a Shift in Structure occurred. This is a good signal for the start of the downward trend in the four hours.

Points of interest (POI)

Sell from: 1.31642 (from OB with the Order flow)

TP 1: 1.30537 (maybe will rebound from there)

TP 2: 1.2900 (will continue the bullish movements in the daily)

Stop loss: 1.3200 (above the OB)

InstaForex Analyst,
انسٹافاریکس کا تجزیاتی ماہر
© 2007-2025
ٹائم فریم منتخب کریں
5
منٹ
15
منٹ
30
منٹ
1
گھنٹہ
4
گھنٹے
1
دن
1
ہفتہ
انسٹافاریکس کے ساتھ کرپٹو کرنسی کی معاملاتی تبدیلیوں سے کمائیں۔
میٹا ٹریڈر 4 ڈاؤن لوڈ کریں اور اپنی پہلی ٹریڈ کھولیں۔
  • Grand Choice
    Contest by
    InstaForex
    InstaForex always strives to help you
    fulfill your biggest dreams.
    مقابلہ میں شامل ہوں

تجویز کردہ مضامین

یو ایس ڈی / جے پی وائے : ابتدائی تاجروں کے لیے آسان تجارتی تجاویز - 10 اپریل (یو ایس سیشن)

تجارتی جائزہ اور جاپانی ین کی تجارت کے لیے نکات یہ کہ 146.88 پر قیمت کا امتحان اس وقت ہوا جب ایم اے سی ڈی اشارے نے مارکیٹ میں داخلے

Jakub Novak 20:58 2025-04-10 UTC+2

یورو / یو ایس ڈی : تجزیہ اور پیشن گوئی

یورو / یو ایس ڈی پئیر مسلسل دوسرے دن مثبت رفتار حاصل کرنے کی کوشش کر رہا ہے، ستمبر میں آخری مرتبہ دیکھی گئی ماہانہ اعلی سطح سے حالیہ واپسی

Irina Yanina 20:17 2025-04-08 UTC+2

تیل اور گیس: تجارتی جنگیں اور ڈومینو اثر

تیل اور گیس کی مارکیٹ نے خود کو ایک نئی تجارتی جنگ کے مرکز میں پایا ہے، جہاں معاشی مفادات اور سیاسی عزائم آپس میں ٹکرا رہے ہیں۔ شہ سرخیوں

Anna Zotova 18:52 2025-04-07 UTC+2

یورو / یو ایس ڈی: ابتدائی تاجروں کے لیے آسان تجارتی تجاویز - 4 اپریل (امریکی سیشن)

یورو کے لیے تجارتی تجزیہ اور سفارشات یہ کہ 1.1050 کی قیمت کا امتحان ایک ایسے وقت میں ہوا جب ایم اے سی ڈی اشارے پہلے ہی صفر کی لکیر

Jakub Novak 21:08 2025-04-04 UTC+2

جی بی پی / یو ایس ڈی: ابتدائی تاجروں کے لیے آسان تجارتی تجاویز - 4 اپریل (یو ایس سیشن)

برطانوی پاؤنڈ کے لیے تجارتی جائزہ اور سفارشات یہ کہ 1.3077 کی قیمت کا امتحان ایسے وقت میں ہوا جب ایم اے سی ڈی اشارے پہلے ہی صفر کی لکیر

Jakub Novak 21:02 2025-04-04 UTC+2

یورو / جے پی وائے: ابتدائی تاجروں کے لیے آسان تجارتی تجاویز - 4 اپریل (امریکی سیشن)

جاپانی ین کے لیے تجارتی جائزہ اور سفارشات یہ کہ 146.16 کی قیمت کا ٹیسٹ ایک ایسے لمحے میں ہوا جب ایم اے سی ڈی انڈیکیٹر پہلے

Jakub Novak 20:47 2025-04-04 UTC+2

ایکس اے یو / یو ایس ڈی : تجزیہ اور پیشن گوئی

سونے کو $3,116 کی سطح کے قریب سپورٹ مل رہی ہے، جو کہ ایک نئی ہمہ وقتی بلندی تک پہنچنے کے بعد اپنے انٹرا

Irina Yanina 18:27 2025-04-03 UTC+2

جی بی پی / یو ایس ڈی تجزیہ اور پیشن گوئی

آج، جی بی پی / یو ایس ڈی پئیر مضبوط ترقی دکھا رہا ہے، جو اکتوبر 2024 میں آخری مرتبہ دیکھی گئی سطح تک پہنچ رہا ہے۔ یہ امریکی ڈالر

Irina Yanina 16:39 2025-04-03 UTC+2

یو ایس ڈی / سی اے ڈی : تجزیہ اور پیشن گوئی

آج، یو ایس ڈی / سی اے ڈی پئیر اپنی سابقہ تنزلی کو روکنے کی کوشش کر رہا ہے، 1.4300 کی سطح سے اوپر لنگر انداز ہونے کی کوشش

Irina Yanina 13:33 2025-04-02 UTC+2

امریکی ڈالر/جاپانی ین: 1 اپریل کو نئے تاجروں کے لیے آسان تجارتی تجاویز - کل کے فاریکس ٹریڈز کا جائزہ

جاپانی ین کے لیے تجارتی جائزہ اور تجارتی تجاویز 149.55 کی سطح کا امتحان ایک ایسے وقت میں ہوا جب MACD اشارے پہلے ہی صفر کی لکیر سے نمایاں

Jakub Novak 11:43 2025-04-01 UTC+2
ابھی فوری بات نہیں کرسکتے ؟
اپنا سوال پوچھیں بذریعہ چیٹ.
Widget callback
 

Dear visitor,

Your IP address shows that you are currently located in the USA. If you are a resident of the United States, you are prohibited from using the services of InstaFintech Group including online trading, online transfers, deposit/withdrawal of funds, etc.

If you think you are seeing this message by mistake and your location is not the US, kindly proceed to the website. Otherwise, you must leave the website in order to comply with government restrictions.

Why does your IP address show your location as the USA?

  • - you are using a VPN provided by a hosting company based in the United States;
  • - your IP does not have proper WHOIS records;
  • - an error occurred in the WHOIS geolocation database.

Please confirm whether you are a US resident or not by clicking the relevant button below. If you choose the wrong option, being a US resident, you will not be able to open an account with InstaForex anyway.

We are sorry for any inconvenience caused by this message.