empty
08.04.2025 07:29 PM
EUR/USD: Trading plan for the U.S. session on April 8th (analysis of the morning trades)

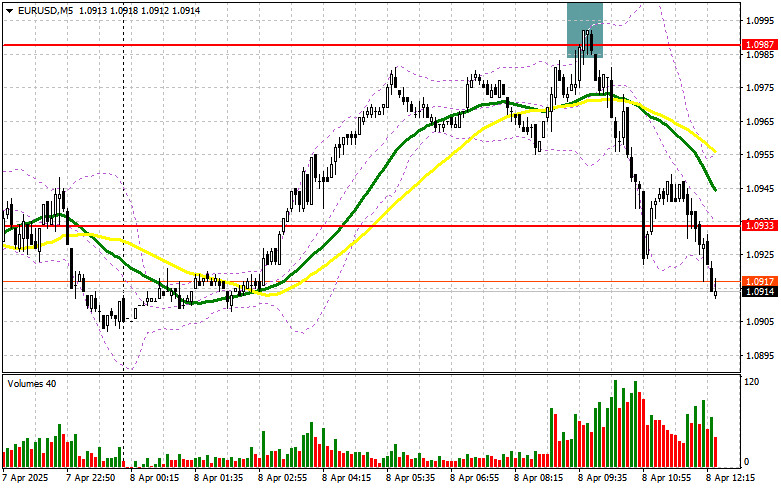
In my morning forecast, I focused on the 1.0987 level and planned to make trading decisions from it. Let's look at the 5-minute chart and see what happened there. A rise and formation of a false breakout at that level provided a good entry point for short positions, resulting in a 50-point drop in the euro. The technical picture has been revised for the second half of the day.

This image is no longer relevant

To open long positions on EURUSD:

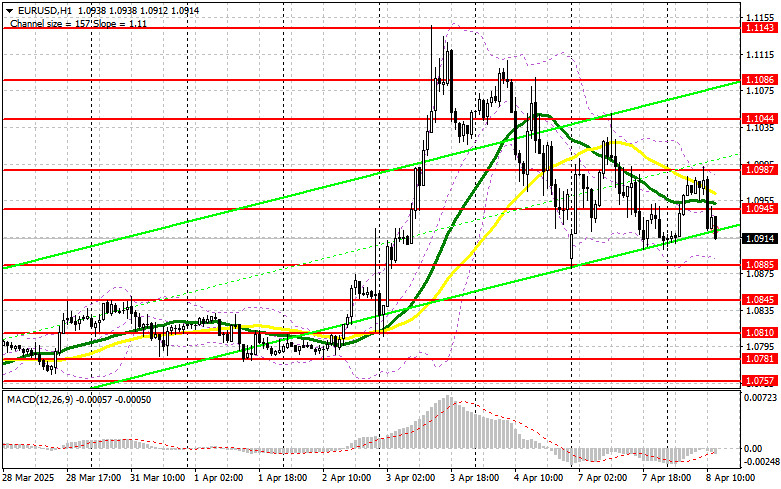
Market volatility remains high, and the lack of important and positive statistics from the Eurozone helps euro sellers become active on any decent rally in the pair. In the second half of the day, only the NFIB Small Business Optimism Index will be released, which is of little interest to currency traders. There will also be a speech by FOMC member Mary Daly, but her remarks are unlikely to have a significant impact on the US dollar. If the euro declines following the reports and speeches, a false breakout around the 1.0885 support area will serve as a signal to buy EUR/USD with the prospect of a bullish market recovery and a retest of 1.0945. A breakout and retest of this range will confirm the correct entry point for buying, aiming at 1.0987, a level that has yet to be surpassed. The ultimate target will be 1.1044, where I will take profit. If EUR/USD declines and shows no activity around 1.0885, pressure on the euro will increase significantly, and the market will shift fully to the sellers' side. In that case, bears may push the pair down to 1.0845. Only after a false breakout forms there will I consider buying the euro. I also plan to open long positions on a rebound from 1.0810, aiming for a 30–35 point intraday correction.

To open short positions on EURUSD:

Sellers have once again proven effective, successfully defending the 1.0987 resistance in the morning. Now I'd like to see the same at 1.0945. If there is a negative market reaction to US data, a false breakout at this level will be enough to enter short positions with a target at the 1.0885 support area. A breakout and consolidation below this range will be a suitable sell signal, with a move toward 1.0845. The ultimate target will be 1.0810, where I plan to take profit. If EUR/USD rises again in the second half of the day and bears do not act around 1.0945, buyers could push the pair back to the daily highs. In this case, I will postpone short positions until the next resistance at 1.0987 is tested. I will sell there only after a failed consolidation, similar to what was discussed earlier. I also plan to open short positions on a rebound from 1.1044, targeting a 30–35 point downward correction.
This image is no longer relevant

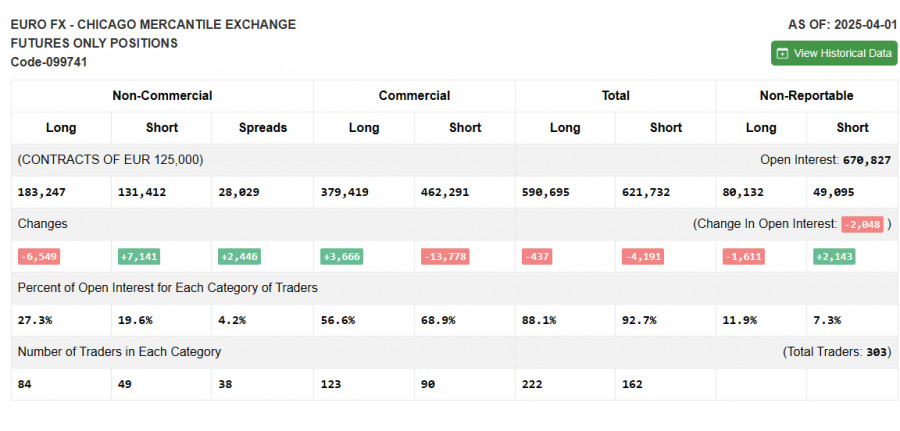
COT Report (Commitment of Traders) as of April 1: A slight increase in short positions and a decrease in long ones was observed. However, it's important to note that this report does not take into account the new US tariffs against key trade partners or the latest March labor market data from the US. Therefore, there's little point in deeply analyzing position dynamics, as it doesn't reflect current reality. The COT report shows that long non-commercial positions declined by 6,549 to 183,247, while short non-commercial positions rose by 7,141 to 131,412. As a result, the gap between long and short positions increased by 2,466.

This image is no longer relevant

Indicator signals:

Moving averages Trading is conducted around the 30- and 50-period moving averages, indicating market uncertainty.

Note: The period and prices of the moving averages are considered by the author on the H1 hourly chart and differ from the classic daily moving average definitions on the D1 chart.

Bollinger Bands In the event of a decline, the lower boundary of the indicator around 1.0885 will act as support.

Indicator descriptions: • Moving average – defines the current trend by smoothing volatility and noise. Period – 50 (marked in yellow on the chart); • Moving average – period – 30 (marked in green on the chart); • MACD indicator (Moving Average Convergence/Divergence) – fast EMA: period 12, slow EMA: period 26, SMA: period 9; • Bollinger Bands – period 20; • Non-commercial traders – speculators such as individual traders, hedge funds, and large institutions using the futures market for speculative purposes and meeting specific criteria; • Long non-commercial positions – total long open positions held by non-commercial traders; • Short non-commercial positions – total short open positions held by non-commercial traders; • Net non-commercial position – the difference between short and long positions of non-commercial traders.

Miroslaw Bawulski,
Especialista em análise na InstaForex
© 2007-2025
EURUSD
Euro vs US Dollar
Summary
Sell
Urgency
1 day
Analytic
Maxim Magdalinin
Start trade
Ganhe com as variações das taxas das criptomoedas com a InstaForex.
Baixe o MetaTrader 4 e abra a sua primeira operação.
  • Grand Choice
    Contest by
    InstaForex
    InstaForex always strives to help you
    fulfill your biggest dreams.
    PARTICIPE DO CONCURSO

Recommended Stories

EUR/USD: Plano de Negociação para a Sessão dos E.U. de 24 de abril (Revisão das Negociações da Manhã)

Na minha previsão matinal, concentrei-me no nível 1,1358 e planejei tomar decisões de negociação com base nele. Vamos dar uma olhada no gráfico de 5 minutos para entender

Miroslaw Bawulski 21:48 2025-04-24 UTC+2

Como negociar o par EUR/USD em 22 de abril? Dicas simples e análise de negociação para iniciantes

Análise das operações de segunda-feira Gráfico 1H do EUR/USD O par EUR/USD iniciou a segunda-feira com uma forte recuperação. Durante a madrugada, o euro avançou entre 100 e 120 pips

Paolo Greco 15:10 2025-04-22 UTC+2

Como negociar o par GBP/USD em 11 de abril? Dicas simples e análise de negociação para iniciantes

Análise das operações de quinta-feira Gráfico 1H do GBP/USD Nas últimas 24 horas, o par GBP/USD avançou 170 pips, e a valorização da libra esterlina continuou durante a madrugada desta

Paolo Greco 16:46 2025-04-11 UTC+2

Como negociar o par GBP/USD em 7 de abril? Dicas simples e análise de negociação para iniciantes

Análise das operações de sexta-feira Gráfico 1H do GBP/USD O par GBP/USD registrou uma forte correção na sexta-feira, um movimento difícil de justificar — mesmo com a vantagem da retrospectiva

Paolo Greco 16:28 2025-04-07 UTC+2

Como negociar o par EUR/USD em 7 de abril? Dicas simples e análise de negociação para iniciantes

Análise das operações de sexta-feira Gráfico 1H de EUR/USD O par EUR/USD permaneceu sob forte instabilidade nesta sexta-feira. Desta vez, o movimento de baixa predominou — mas isso não tornou

Paolo Greco 15:51 2025-04-07 UTC+2

EUR/USD: Plano de Negociação para a Sessão dos E.U.A de 4 de Abril (Revisão das Negociações da Manhã)

Na minha previsão matinal, destaquei o nível 1,0994 e planejei basear minhas decisões de entrada no mercado nele. Vamos dar uma olhada no gráfico de 5 minutos e analisar

Miroslaw Bawulski 19:56 2025-04-04 UTC+2

Recomendações de negociação e análise para o GBP/USD em 4 de abril: Será que Powell conseguirá virar o jogo?

O par GBP/USD também registrou um forte movimento de alta na quinta-feira, impulsionado por um único fator. No final da noite de quarta-feira, Donald Trump anunciou a imposição de novas

Paolo Greco 15:56 2025-04-04 UTC+2

GBP/USD: Plano de Negociação para a Sessão dos E.U. de 3 de abril (Revisão das negociações da manhã)

Na minha previsão matinal, destaquei o nível 1,3098 como referência para decisões de entrada. Agora, vamos analisar o gráfico de 5 minutos para entender o que ocorreu. Após um declínio

Miroslaw Bawulski 21:58 2025-04-03 UTC+2

EUR/USD: Plano de negociação para a sessão dos E.U.A. de 1 de abril (análise das negociações da manhã)

Na minha previsão da manhã, destaquei o nível 1,0815 e planejei tomar decisões de entrada no mercado com base nele. Vamos dar uma olhada no gráfico de 5 minutos

Miroslaw Bawulski 20:20 2025-04-01 UTC+2

GBP/USD: Plano de Negociação para a Sessão dos E.U.A de 26 de março (Revisão das Negociações da Manhã)

Na minha previsão desta manhã, destaquei o nível de 1,2926 como um ponto-chave para decisões de negociação. Agora, vamos analisar o gráfico de 5 minutos e ver o que aconteceu

Miroslaw Bawulski 19:14 2025-03-26 UTC+2
Não pode falar agora?
Faça sua pergunta no chat.
Widget callback
 

Dear visitor,

Your IP address shows that you are currently located in the USA. If you are a resident of the United States, you are prohibited from using the services of InstaFintech Group including online trading, online transfers, deposit/withdrawal of funds, etc.

If you think you are seeing this message by mistake and your location is not the US, kindly proceed to the website. Otherwise, you must leave the website in order to comply with government restrictions.

Why does your IP address show your location as the USA?

  • - you are using a VPN provided by a hosting company based in the United States;
  • - your IP does not have proper WHOIS records;
  • - an error occurred in the WHOIS geolocation database.

Please confirm whether you are a US resident or not by clicking the relevant button below. If you choose the wrong option, being a US resident, you will not be able to open an account with InstaForex anyway.

We are sorry for any inconvenience caused by this message.