GBP/USD
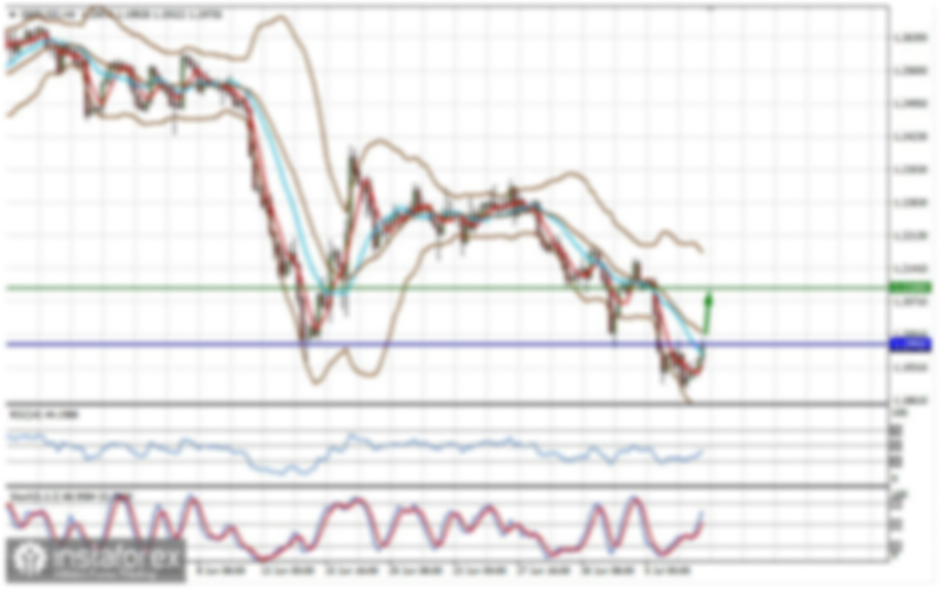
Analysis: Since the beginning of this year, GBP/USD has been forming an upward wave on the daily chart. The pair has now reached the boundaries of a wide potential reversal zone. At the time of analysis, price is near the calculated resistance area.
Forecast: In the coming days, pressure on the resistance zone is expected. A reversal and the beginning of a bearish move may follow. If the trend changes, a brief breakout above the resistance boundary is possible. The lower edge of the expected weekly range is defined by the calculated support.
Potential Reversal Zones:
- Resistance: 1.3300–1.3350
- Support: 1.3100–1.3050
Recommendations:
Buying: No conditions expected this week.
Selling: Becomes relevant once confirmed reversal signals appear near resistance.
AUD/USD
Analysis: Since early April, AUD/USD has been trending upward in a short-term wave. A week ago, the price reached a strong potential reversal zone on the higher time frame and has since entered a corrective pullback.
Forecast: A gradual shift from resistance toward support is expected this week. A breakout beyond these levels is unlikely. A temporary rise and renewed pressure on resistance may occur early in the week.
Potential Reversal Zones:
- Resistance: 0.6410–0.6460
- Support: 0.6230–0.6280
Recommendations:
- Buying: Possible with a reduced lot size during individual sessions. The upward movement is limited.
- Selling: May be used once confirmed reversal signals appear near resistance.
USD/CHF
Analysis: Since January, USD/CHF has been in a short-term downtrend that completes a larger bearish wave on the weekly time frame. The wave has entered its final phase. The lower boundary of a strong potential reversal zone lies near the calculated support.
Forecast: This week may mark the end of the current bearish trend. A brief dip toward support is possible in the next few days. A reversal and the beginning of price growth could follow. Volatility may increase toward the end of the week.
Potential Reversal Zones:
- Resistance: 0.8300–0.8350
- Support: 0.8100–0.8050
Recommendations:
Selling: High risk and potentially unprofitable.
Buying: Valid once confirmed reversal signals appear near support.
EUR/JPY
Analysis: EUR/JPY has been forming an upward trend wave since late February. Since mid-March, a sideways correction (B) has been developing. Price remains within a horizontal channel.
Forecast: Sideways movement is expected in the next day or two. A downward move may test the lower support zone, but not break through. Toward the second half of the week, volatility may rise along with a possible reversal and resumed upward movement.
Potential Reversal Zones:
- Resistance: 163.30–163.80
- Support: 161.30–160.80
Recommendations:
Selling: Risky, with low potential.
Buying: May be used after confirmation signals appear near support.
AUD/JPY
Analysis: AUD/JPY has been in a downtrend since last summer. This structure now appears complete. As of the current analysis, price has rebounded from the upper edge of the weekly potential reversal zone. The upward move from April 7 shows potential for reversal.
Forecast: Early in the week, the pair may again test support. A brief dip below it is possible. By the weekend, a reversal and renewed growth become more likely.
Potential Reversal Zones:
- Resistance: 94.00–94.50
- Support: 89.80–89.30
Recommendations:
Selling: Possible intraday with small volumes; limited potential.
Buying: Relevant after confirmation signals appear near support.
USD Index (US Dollar Index)
Brief Analysis: Since February, the USD Index has been forming a descending wave. Wave (C), which looks complete, is the final segment. However, no reversal signals have appeared. After testing the upper boundary of the reversal zone last week, the index entered a sideways drift.
Weekly Forecast: A trend reversal may occur this week. In the support zone, the index may shift sideways before starting a reversal. A bullish move could begin toward the end of the week.
Potential Reversal Zones:
- Resistance: 99.90–100.10
- Support: 99.00–98.80
Recommendations: The period of dollar weakness and preference for major currencies may be coming to an end. After reversal signals appear near support, selling national currencies in major pairs may become the main trading direction.
Notes: In Simplified Wave Analysis (SWA), all waves consist of three parts (A-B-C). The analysis focuses only on the last, unfinished wave within each timeframe. Dotted lines indicate expected price movements.
Attention: The wave model does not take time duration into account.