The EUR/USD currency pair declined sharply overnight on Wednesday but showed some recovery during the day. On Thursday, there was further growth—this series of fluctuations can only be described as a roller coaster. The pair's current movements fully reflect the underlying fundamental backdrop. It's changing at an incredible pace, and the White House's statements now resemble a comedy routine.
Wednesday's events began with China responding by raising tariffs on U.S. imports to 84%. The White House didn't wait long and upped tariffs on China to 125%. Then came another message from the same White House—not directly from Trump—about a potential increase in tariffs on China to 500%. However, that news was later classified as false. Instead, Trump announced a 90-day tariff freeze, or so he said. At the same time, the tariffs would remain in place, just reduced to a minimum rate of 10%. On this news, the dollar strengthened somewhat on Wednesday evening and Thursday night. But during the day on Thursday, it became clear that the market didn't share Trump's "peaceful" tone and was still unwilling to buy the U.S. dollar.
The U.S. president explained his decision by saying that many countries had approached him, ready to discuss trade deals. To avoid hurting people and giving countries a chance to negotiate with the U.S., Trump introduced the 90-day grace period. In other words, the American president once again took on the role of peacemaker. One might get the impression that Trump genuinely wants peace and fairness. The problem is that peace doesn't go hand-in-hand with war. Trump starts the war (a trade war) and then loudly proclaims that he wants peace—but only if others pay for it.
That's why the dollar failed to continue rising on Thursday. Because Trump's version of peace = accepting Trump's ultimatums. Fulfill all his demands, and you can rest easy—until the next round of ultimatums. What's to stop the U.S. president from discovering new "injustices" every quarter? So, after the partial suspension of tariffs and the start of the grace period, tensions in the market eased slightly. Even the European Union accepted Trump's offer for negotiations and canceled its 25% tariffs on all U.S. exports starting April 16.
However, no one knows how the negotiations themselves will go. Trump's team might again take an ultimatum-based approach. Previously, the message was that countries must remove all restrictions, taxes, and tariffs on American goods. Who's to say the U.S. position will be any different this time? And if it isn't, then what's the point of negotiations? Those who agree will accept Washington's terms; those who don't—won't. All of this could have happened without any negotiating process at all. From our perspective, the fundamental backdrop hasn't changed since yesterday, which means the dollar will still struggle to grow until Trump backs off.
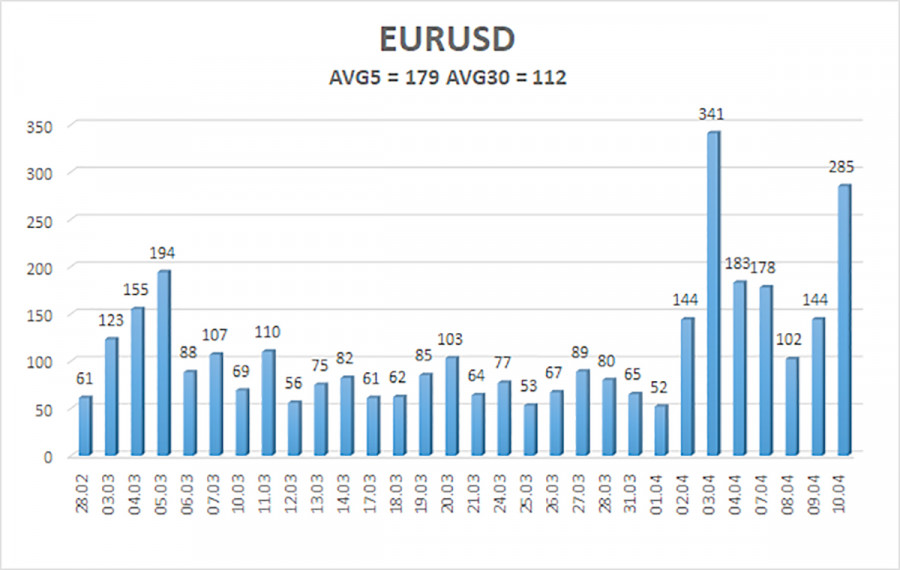
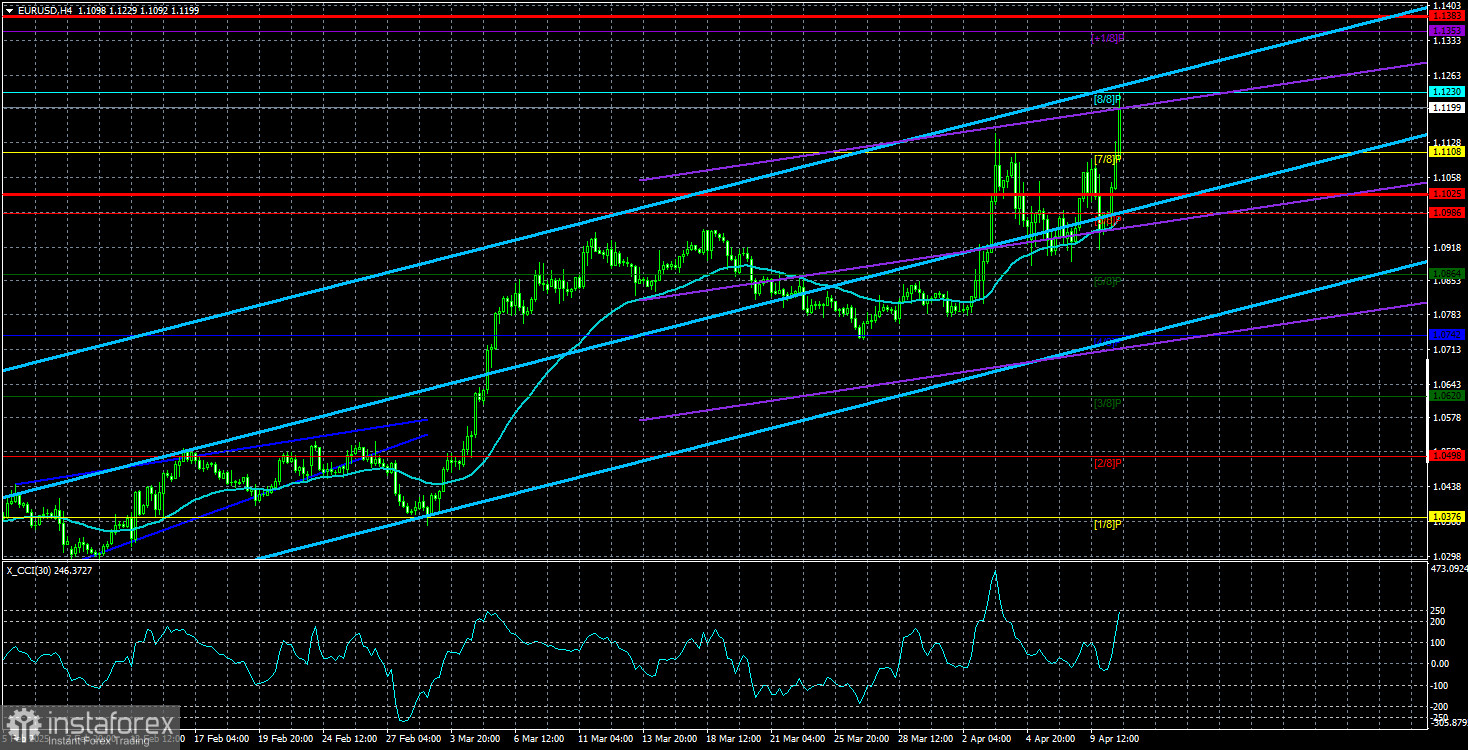
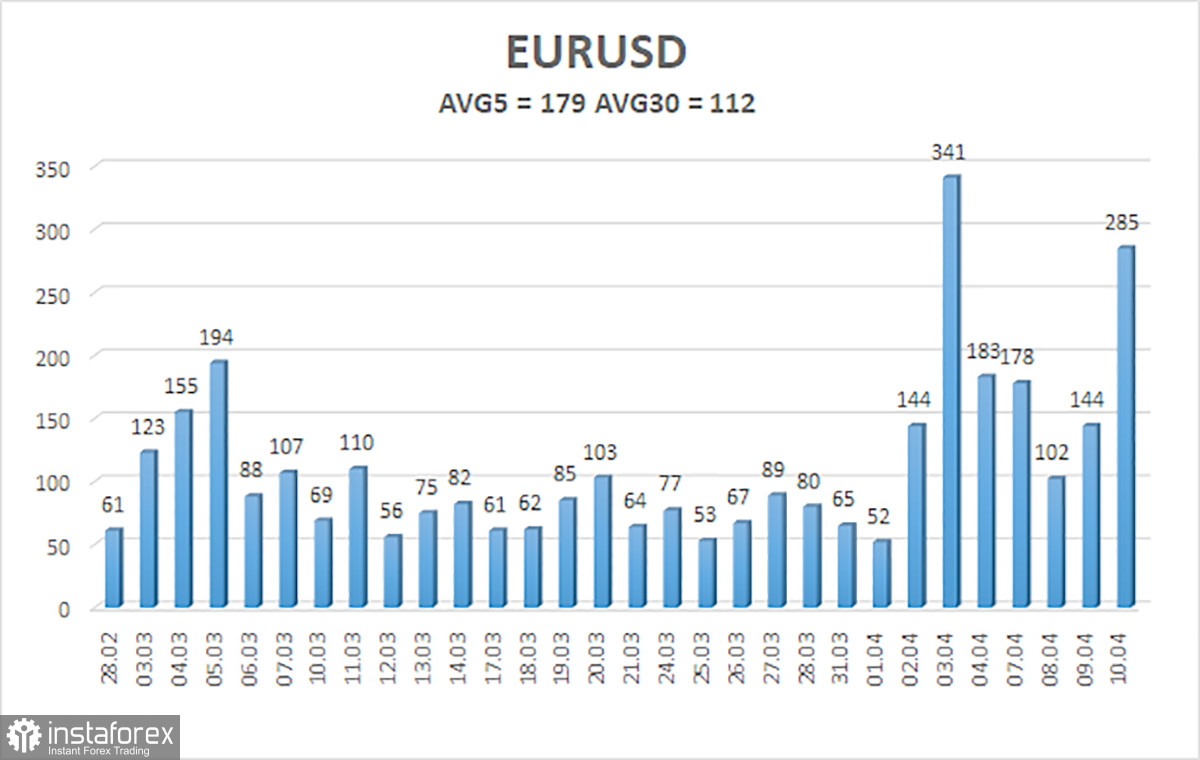
The average volatility of the EUR/USD pair over the last five trading days as of April 11 is 179 points, which is considered "high." We expect the pair to move between the levels of 1.1025 and 1.1383 on Friday. The long-term regression channel is pointing upward, indicating a short-term uptrend. The CCI indicator entered the overbought zone earlier, signaling a correction—which now appears to be over.
Nearest Support Levels:
S1 – 1.1108
S2 – 1.0986
S3 – 1.0864
Nearest Resistance Levels:
R1 – 1.1230
R2 – 1.1353
R3 – 1.1475
Trading Recommendations:
The EUR/USD pair maintains its upward trend. In recent months, we've consistently stated that we expect a medium-term decline for the euro—and nothing has changed in that regard. Except for Donald Trump, the dollar still has no real reason to fall in the medium term. Yet that reason alone continues to push the dollar into the abyss. This situation is unprecedented and quite rare for the currency market.
Short positions remain attractive, with targets at 1.0315 and 1.0254, but it's tough to say when the Trump-fueled euro rally will end—or how many more tariffs and sanctions the American president will impose. If you're trading purely based on technical signals, long positions are valid if the price remains above the moving average, with targets at 1.1353 and 1.1383.
Explanation of Illustrations:
Linear Regression Channels help determine the current trend. If both channels are aligned, it indicates a strong trend.
Moving Average Line (settings: 20,0, smoothed) defines the short-term trend and guides the trading direction.
Murray Levels act as target levels for movements and corrections.
Volatility Levels (red lines) represent the likely price range for the pair over the next 24 hours based on current volatility readings.
CCI Indicator: If it enters the oversold region (below -250) or overbought region (above +250), it signals an impending trend reversal in the opposite direction.