empty
23.04.2025 06:40 PM
GBP/USD Analysis on April 23, 2025

This image is no longer relevant

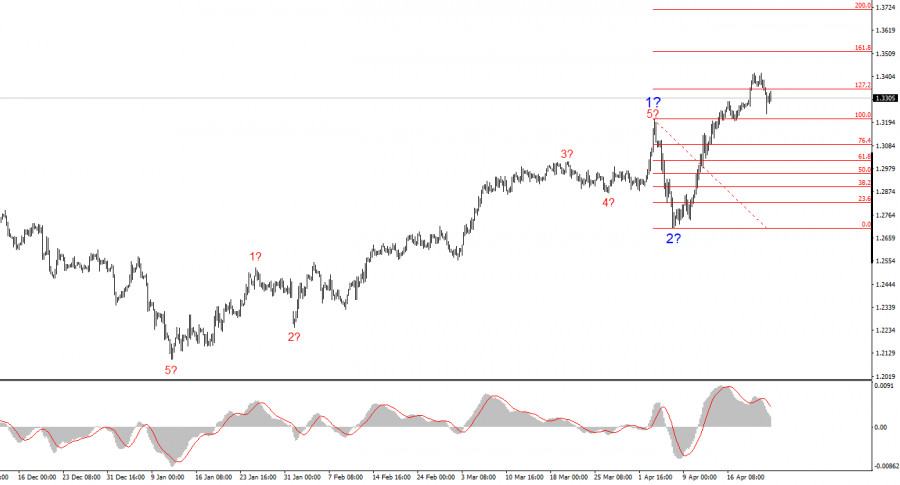
The wave structure on the GBP/USD chart has also shifted to a bullish, impulsive form — "thanks" to Donald Trump. The wave pattern is nearly identical to that of EUR/USD. Until February 28, we observed the development of a convincing corrective structure that raised no concerns. However, then demand for the US dollar began to decline sharply. The result was the formation of a five-wave upward structure. Wave 2 took the form of a single wave and is now complete. Therefore, we should expect a strong upward movement of the pound within wave 3 — a movement we've already been witnessing for more than a week.

Taking into account the fact that the UK news flow has had no impact on the strong rise of the pound, we can conclude that currency markets are being driven solely by Donald Trump. If (theoretically) Trump's trade policy stance changes, it's entirely possible that the trend will change too — this time to a downward one. Therefore, in the coming months (or possibly years), close attention should be paid to every action coming from the White House.

On Wednesday, the GBP/USD pair saw almost no change during the European session. Overnight, however, the pound first fell sharply and then rose just as strongly. These movements were triggered by contradictory statements from Trump, who initially fired Jerome Powell, only to then decide to keep him as Fed Chair. As a result, the market first sold the dollar, then bought it again — temporarily forgetting about the Trade War altogether.

This morning in the UK, PMI reports for the services and manufacturing sectors were released, but they had no real impact on market sentiment. Both indices slowed in April, with the services PMI falling from 52.5 to 48.9. Now both sectors are trending downward, and the UK economy will likely continue to slow. This data could have triggered a drop in demand for the pound — but to sell the pound, the market would have to buy the dollar. And right now, the dollar is like a red flag to a bull. No one wants to buy it, nor American stocks or bonds. A recession is forecast for the US economy — and while the same is likely true for the UK, the focus remains on Trump and the dollar.

It's worth noting that investors value stability — something the world's #1 economy can no longer boast. No one knows how the trade battles will end, which deals will be signed, or how China and the US will eventually come to terms. This lack of clarity discourages investors from buying the US dollar.

This image is no longer relevant

Final Thoughts

The wave structure of GBP/USD has shifted. We are now dealing with a bullish, impulsive trend segment. Unfortunately, with Donald Trump in charge, markets may experience many more shocks and reversals that defy wave analysis and any other form of technical forecasting. The presumed wave 2 is complete since prices have already surpassed the peak of wave 1. Therefore, wave 3 is in progress, with initial targets at 1.3345 and 1.3541. Of course, it would be ideal to see a corrective wave 2 within wave 3 — but that would require the dollar to rise and for that to happen, someone needs to start buying it.

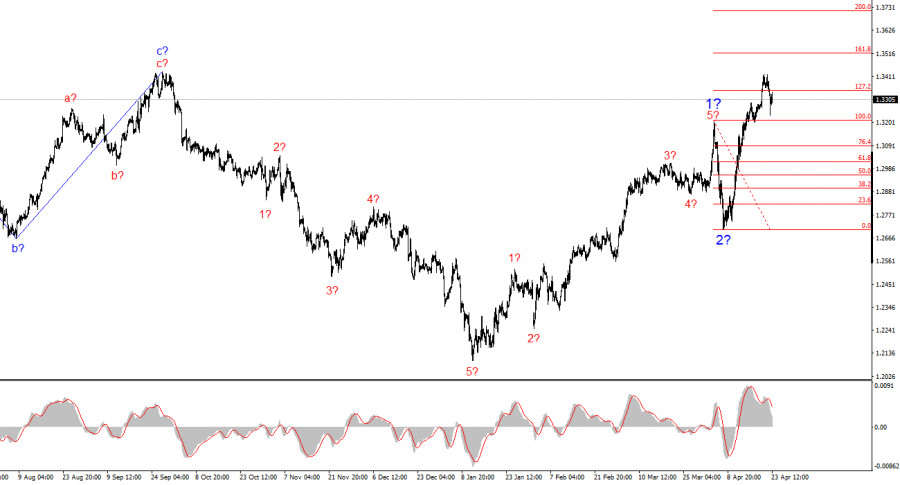
On the higher wave scale, the structure has also shifted to bullish. We can now anticipate the development of an upward trend phase. The nearest targets: 1.2782 and 1.2650.

Key Principles of My Analysis:

  1. Wave structures should be simple and clear. Complex structures are harder to trade and are often subject to change.
  2. If you're unsure of what's happening in the market, it's better to stay out.
  3. There's never 100% certainty in market direction. Always use Stop Loss orders.
  4. Wave analysis can be combined with other types of analysis and trading strategies.
Seleccione el marco de tiempo
5
min
15
min
30
min
1
hora
4
horas
1
día
1
s.
Gana con los cambios en el valor de las criptomonedas con InstaForex.
Descarga MetaTrader 4 y abre tu primera operación.
  • Grand Choice
    Contest by
    InstaForex
    InstaForex always strives to help you
    fulfill your biggest dreams.
    UNIRSE AL CONCURSO

Recommended Stories

SP500 25 de abril. ¡Subimos siguiendo a Bitcoin!

Desde el punto de vista de las ondas de Elliott, en el índice se está formando una gran tendencia impulsiva en una perspectiva global. No hace mucho se completó

Roman Onegin 10:06 2025-04-25 UTC+2

NG 12 Feb. ¡Los toros mantienen el rumbo hacia un máximo de 4,31!

El marco temporal de cuatro horas muestra el trazado de una onda activa principal (Y), que tiene una forma interna compleja y es un doble zigzag de un nivel

Roman Onegin 07:26 2025-02-12 UTC+2

SP500 12 de febrero. ¡Después de la finalización de la segunda parte del impulso, el precio puede subir más activamente!

Lo más probable es que se esté formando una tendencia alcista mayor en el panorama global del SP500, cuya estructura es similar a la del impulso. Si nos fijamos

Roman Onegin 07:26 2025-02-12 UTC+2

Análisis del par EUR/USD. El 7 de julio. ¿Dónde se encuentra la raíz de todos los problemas del dólar?

El conteo de ondas en el gráfico de 4 horas para el instrumento EUR/USD permanece sin cambios. Actualmente estamos observando la formación de la supuesta onda

Chin Zhao 15:58 2024-07-07 UTC+2

Análisis del par EUR/USD. El 6 de julio. El destino complicado del dólar.

El conteo de ondas en el gráfico de 4 horas para el instrumento EUR/USD permanece sin cambios. Actualmente estamos observando la formación de la supuesta onda

Chin Zhao 15:57 2024-07-07 UTC+2

Análisis del par GBP/USD. El 6 de julio. La libra quiere caer, pero no puede.

La estructura de ondas del instrumento GBP/USD sigue siendo bastante complicada y muy confusa. Alrededor del nivel de 1.2822, que corresponde al 23.6% de Fibonacci y está cerca del pico

Chin Zhao 15:57 2024-07-07 UTC+2

Análisis del par GBP/USD. El 22 de junio. El mercado espera la primera bajada de los tipos de interés en agosto.

El patrón de onda para el instrumento GBP/USD sigue siendo bastante complicado y confuso. Un intento exitoso de romper el nivel de Fibonacci del 50,0% en abril indicó

Chin Zhao 13:12 2024-06-22 UTC+2

Análisis del par EUR/USD. El 22 de junio. La Fed: No está lista para el aterrizaje.

En el gráfico de 4 horas, no hay cambios en la marca de la onda para el instrumento EUR/USD. En este momento, observamos la construcción de la esperada onda

Chin Zhao 10:51 2024-06-22 UTC+2

Análisis del par GBP/USD. El 8 de junio. Los británicos retrocedieron, pero no se rindieron.

El patrón de onda para el instrumento GBP/USD sigue siendo bastante complicado. El intento exitoso de romper el nivel de Fibonacci del 50,0% en abril indicó que el mercado está

Chin Zhao 08:27 2024-06-09 UTC+2

Análisis del par EUR/USD. El 8 de junio. El BCE confía en una mayor desaceleración de la inflación.

El patrón de onda del gráfico de 4 horas para el instrumento EUR/USD se mantiene sin cambios. En este momento, estamos observando la construcción de la onda esperada

Chin Zhao 08:26 2024-06-09 UTC+2
¿No puede hablar ahora mismo?
Ingrese su pregunta en el chat.
Widget callback